
|
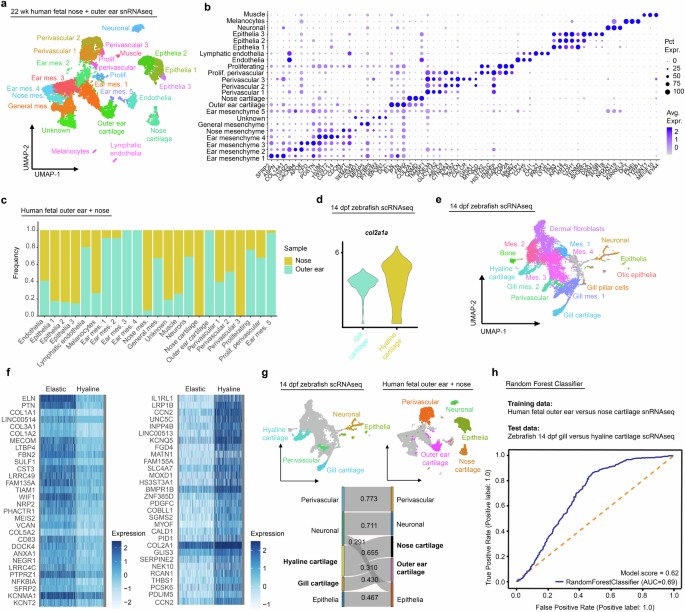
Fig. Ext. 2 a, Merged human fetal outer ear and nose snRNAseq datasets with cell-type assignments for each cluster. b, Dot plot of genes selected from top 10 differentially expressed for each cluster. c, Bar chart plotting proportion of each cell type found within human fetal outer-ear versus nose libraries. d, Violin plot depicting expression of col2a1a in zebrafish 14 dpf hyaline versus gill elastic cartilage from previously published scRNAseq data3. e, Cell clusters from 14 dpf zebrafish CNCC scRNAseq used for SAMap analysis in Fig. 2d. f, Heatmaps showing top 30 differentially expressed genes in human outer-ear elastic versus nose hyaline cartilage. g, Top: Human fetal outer ear and nose and zebrafish 14 dpf CNCC clusters with cell types included in SAMap analysis colored. Bottom: Sankey plot showing cell-type homology mapping and alignment scores derived from SAMap analysis. An alignment score threshold of 0.25 was used. h, Receiver operating characteristic (ROC) curve plotted for random forest classifier trained on human fetal outer-ear and nose cartilage transcriptomes and tested on 14 dpf zebrafish gill and hyaline cartilage transcriptomes.