
- Title
-
The transcriptional repressor HEY2 regulates mitochondrial oxidative respiration to maintain cardiac homeostasis
- Authors
- She, P., Gao, B., Li, D., Wu, C., Zhu, X., He, Y., Mo, F., Qi, Y., Jin, D., Chen, Y., Zhao, X., Lin, J., Hu, H., Li, J., Zhang, B., Xie, P., Lin, C., Christoffels, V.M., Wu, Y., Zhu, P., Zhong, T.P.
- Source
- Full text @ Nat. Commun.
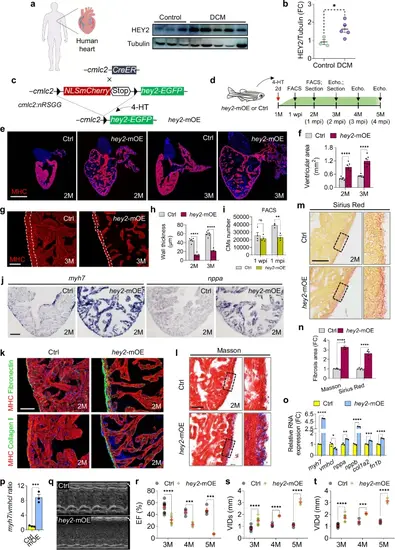
Hey2 upregulation in adult hearts causes cardiac dilation and heart failure.a, b Western blots analysis and quantification of HEY2 in DCM patients and normal human hearts. 3 biological replicates. c Diagram of transgenic zebrafish used for inducible expression of Hey2 in CMs. d Schematic of 4-HT treatment and cardiac analysis for hey2-mOE and Ctrl zebrafish. e, f Section images stained with anti-MHC antibody (red) and quantification of ventricular area of hey2-mOE and Ctrl ventricles at 2 and 3 months. n = 5 (Ctrl), n = 7 (OE). Scale bar: 500 µm. g Immunofluorescence images of anti-MHC antibody in hey2-mOE and Ctrl fish at 3 months old. The dotted line depicts the ventricular wall. Scale bar: 100 µm. h Quantification of ventricular wall thickness of hey2-mOE and Ctrl fish. 2 months: n = 6 (Ctrl), n = 7 (OE). 3 months: n = 6 (Ctrl, OE). i Quantification of CM number of hey2-mOE and Ctrl fish at 1 wpi and 1 mpi by FACS analysis. 1 wpi (4 biological replicates); 1 mpi (3 biological replicates). j ISH analyses of myh7 and nppa expression in hey2-mOE and control ventricles. Scale bar: 100 µm. k Section images of ventricles from hey2-mOE and Ctrl fish. Co-staining: anti-fibronectin (green) and anti-MHC antibodies (red); anti-collagen I (green) and anti-MHC antibodies (red). n = 6 hearts. Scale bar: 50 µm. l, m Masson’s trichrome and Sirius red staining of hey2-mOE and control hearts. Higher-magnification of the dashed boxes (right). Scale bar: 50 µm. n Fibrosis area quantification in hey2-mOE and control hearts. n = 5. o, p RT-qPCR analysis of myh7, vmhcl, nppa, nppb, col1a, fn1b and myh7/vmhcl ratio in hey2-mOE and control hearts. 3 biological replicates. q Representative M-mode echocardiography images of hey2-mOE and control hearts at 3 months old. r–t Analysis of EF, VIDs and VIDd of hey2-mOE and control hearts. 3 months: n = 9 (Ctrl), n = 10 (OE). 4 months: n = 4 (Ctrl, OE). 5 months: n = 4 (Ctrl), n = 3 (OE). Data presents as mean ± SEM, *P < 0.05, **P < 0.01, ***P < 0.001, ****P < 0.0001, Student’s t-test (unpaired, two-tailed) (b, p) or Multiple t tests (two-tailed) (f, h, i, n, o, r–t). 2 months old (j, k, l, m). Source data are provided as a Source Data file. |
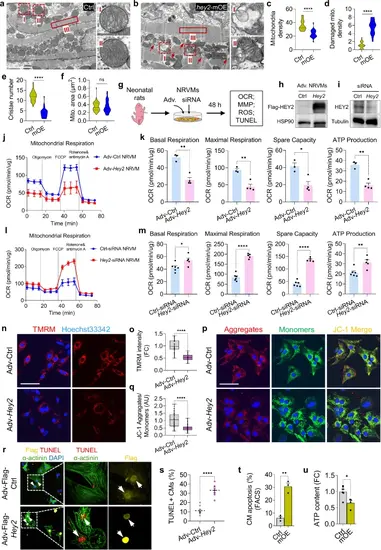
Induced Hey2 expression in adult CMs impairs mitochondrial biogenesis and respiration.a, b Representative TEM images of 2-month-old hey2-mOE and control hearts. Red arrow: degraded mitochondria. Higher-magnification images of the dashed boxes are shown on the right. Scale bar: 2 µm. c–f Quantifications of mitochondria density, damaged mitochondria density, cristae number and mitochondria (mito) area in hey2-mOE and control hearts. density (mito number per 25 µm2): 20 fields. cristae: 28 mito. area: 50 mito. ****P < 0.0001, Student’s t-test (unpaired, two-tailed). g Diagram of experimental design for OCR, MMP, ROS or TUNEL staining using adenovirus-infected or siRNAs-transfected NRVMs. h Western blots analysis of Flag-HEY2 using anti-Flag antibody in Adv-Hey2- and Adv-Ctrl-infected NRVMs. i Western blots analysis of HEY2 in Ctrl- and Hey2-siRNA-transfected NRVMs. j–m OCR analyses and quantification of basal respiration, maximal respiration, spare respiratory capacity and ATP production in Adv-Hey2- and Adv-Ctrl-infected NRVMs (j, k), as well as in Ctrl- and Hey2-siRNA-transfected NRVMs (l, m). n = 3 (Adv-Ctrl), n = 4 (Adv-Hey2), n = 6 (Ctrl-siRNA), n = 5 (Hey2-siRNA). n, p TMRM (red) staining (n) and JC-1 staining (p) in Adv-Hey2- and Adv-Ctrl-infected NRVMs. JC-1 aggregates (red, polarization), JC-1 monomers (green, depolarization). Scale bar: 50 µm. o Quantification of TMRM fluorescent intensity. Adv-Ctrl: n = 44, Adv-Hey2: n = 18. q Quantification of JC-1 aggregates/monomers ratio. n = 49 (Adv-Ctrl), n = 57 (Adv-Hey2). r TUNEL (red) staining of Adv-Hey2-Flag- and Adv-Flag- (Ctrl) infected NRVMs. α-actinin antibody: NRVMs (green). Flag antibody: infected-adenovirus (yellow). Scale bar: 50 µm. s Apoptosis percentage of Adv-transduced NRVMs. n = 8 fields. t Quantification of CM apoptosis in hey2-mOE and control hearts at 2 months old by FACS analysis. 3 biological replicates. u ATP level in hey2-mOE and control hearts at 2 months old. Ctrl: 6 biological replicates, hey2-mOE: 4 biological replicates. Box plots displayed median ± interquartile range (IQR), with whiskers extending to the minimum and maximum values. ****P < 0.0001, Student’s t-test (unpaired, two-tailed) (o, q). Data presents as mean ± SEM, *P < 0.05, **P < 0.01, ****P < 0.0001, Student’s t-test (unpaired, two-tailed) (k, m, s, t, u). Data presents as mean ± SD (j, l). Source data are provided as a Source Data file. |
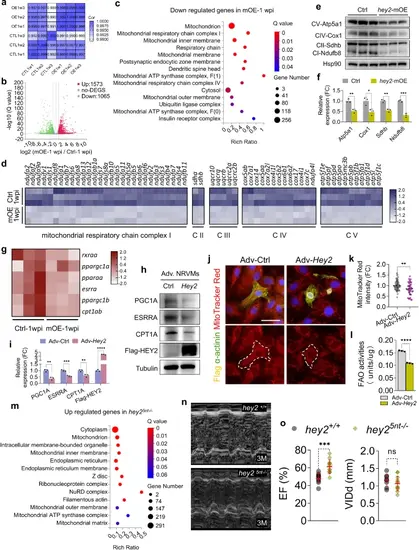
Hey2 preserves cardiac homeostasis by negatively regulating mitochondrial respiration pathways.a Pearson correlation coefficients analysis showing the correlation between biological replicates of aligned RNA-seq data form hey2-mOE and control hearts. Correlation coefficient closer to 1 indicates better agreement. 3 biological replicates. b Volcano plot of expressed genes in hey2-mOE-1 wpi and control hearts. The colored dots were the differentially expressed genes (DEGs). Red: upregulated DEGs, green: downregulated DEGs. The horizontal dot line indicated Q < 0.05. The vertical line indicated fold change of 2. c GO analysis based on cellular component of downregulated genes in the hey2-mOE-1 wpi profile. d Heatmap of expression profile of affected mitochondrial ETC complex I, II, III, IV and V genes in hey2-mOE-1 wpi and control heart (FC > 1.5 and Q < 0.05). e, f Western blots analysis and quantification of ETC complexes in hey2-mOE and control heart at the age of 2 months. 3 biological replicates. g Heatmap of expression profile of master regulators of mitochondria biogenesis in hey2-mOE-1 wpi and control heart (FC > 1.4 and Q < 0.05). h, i Western blots analysis and quantification of PGC1A, ESRRA, CPT1A and Flag-HEY2 protein in Adv-Hey2- and Adv-Ctrl-infected NRVMs. 3 biological replicates. j MitoTracker Red CMXRos (red) staining measuring the mitochondrial mass of Adv-Hey2- and Adv-Ctrl-infected NRVMs. The NRVMs was marked by CM marker α-actinin (green). The anti-Flag antibody showed the nuclear-located HEY2-Flag protein (yellow). Scale bar: 50 µm. k Quantification of MitoTracker Red fluorescent intensity in Adv-Hey2- and Adv-Ctrl-infected NRVMs. Adv-Ctrl: n = 69, Adv-Hey2: n = 38. l Measurement of FAO activities in Adv-Hey2- and Adv-Ctrl-infected NRVMs. 3 biological replicates. m GO analysis based on cellular component of upregulated genes in the hey25nt-/- profile. n Representative long-axis M-mode echocardiography images of hey2+/+ and hey25nt-/- hearts at the age of 3 months. o Echocardiography analysis of EF and VIDd of hey2+/+ and hey25nt-/- hearts. hey2+/+: n = 9, hey25nt-/-: n = 12. Data presents as mean ± SD, *P < 0.05, **P < 0.01, ***P < 0.001, ****P < 0.0001, Student’s t-test (unpaired, two-tailed) (k, l, o) or Multiple t tests (two-tailed) (f, i). Source data are provided as a Source Data file. |
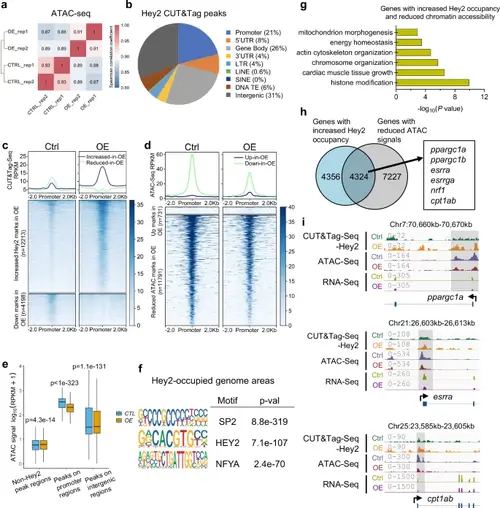
Hey2 overexpression represses the transcription of Ppargc1 energy coactivator complex genes in zebrafish hearts.a Spearman correlation coefficients analysis showing the correlation between biological replicates of ATAC-seq samples from hey2-mOE and control hearts. Correlation coefficient closer to 1 indicates better agreement. b Pie chart of Hey2 peak distribution determined from whole-genome CUT&Tag sequencing data. Promoter was defined as ± 500 bp from the transcription start site (TSS). c, d Heatmaps of Hey2 CUT&Tag-seq and ATAC-seq signals in hey2-mOE hearts compared to control hearts, using a 2 kb window centered on promoter regions and sorted in descending order by signal intensity. e Boxplot showing ATAC-seq mark signals in the Hey2-occupied promoter regions (n = 6752 regions each group), Hey2-bound intergenic regions (n = 20826 regions each group), and non-Hey2-occupied regions (n = 6752 regions each group) in hey2-mOE hearts and control hearts. Signal intensity is represented by the log10 (RPKM + 1) value of ATAC-seq data. Box plots displayed median ± interquartile range (IQR), with whiskers extending to 1.5*IQR. P value by paired Wilcoxon test. f Top enriched motifs of SP2, HEY2 (E box) and NFYA at Hey2-occupied genome regions. Hey2-occupied areas were defined by peaks called from Hey2 CUT&Tag-seq. Binomial test by “CentriMo” algorithm of software package “MEME Suite”. P value was adjusted by Bonferroni correction. g Bar graph showing -log10 P values for GO categories significantly represented in the overlapped genes with increased Hey2 binding peaks and reduced chromatin accessibility on the promoter regions in hey2-mOE hearts. Hypergeometric test by “enrichGO” function of R package “clusterProfiler”. P value was adjusted by Benjamini-Hochberg correction. h Venn diagram outlining 4324 overlapped genes between genes with increased Hey2 binding (CUT&Tag-seq up) and reduced chromatin accessibility (ATAC-seq down) in hey2-mOE hearts (including ppargc1a, ppargc1b, esrra, esrrga, nrf1 and cpt1ab). i The Genome browser views at loci of ppargc1a, esrra and cpt1ab showing Hey2 CUT&Tag-seq, ATAC-seq, and RNA-seq signals from hey2-mOE and control hearts. The signal values are indicated on the left. 2 biological replicates. Source data are provided as a Source Data file. |

Genomic-wide analysis of Hey2-mediated chromatin occupancy, histone deacetylation and chromatin condensation in NRVMs.a Schematic diagram for CUT&Tag-seq and ATAC-seq analysis using Adv-Hey2-transduced or siRNAs-transfected NRVMs. b, c Heatmaps of H3K9ac and H3K27ac CUT&Tag-seq signals in Adv-Hey2-infected NRVMs compared to controls, using a 3 kb window centered on peak regions and sorted in descending order by signal intensity. d Venn diagram outlining 1484 overlapped genes between genes with HEY2 binding peaks and reduced H3K9 acetylation and/or H3K27 acetylation in the promoter regions. e, f The Genome browser views at locus of Ppargc1b and Esrra showing marks of Flag-HEY2, H3K9ac, H3K27ac CUT&Tag-seq and RNA-seq from Adv-Ctrl- and Adv-Hey2-infected NRVMs; and also showing marks of HDAC1 CUT&Tag, ATAC-seq from Ctrl-siRNA- and Hey2-siRNA (knockdown, KD)-transfected NRVMs or Adv-Ctrl- and Adv-Hey2-infected NRVMs. 2 biological replicates. g, h Hey2 or Hdac1 immunoprecipitation with anti-Flag antibody or anti-HA antibody, respectively. Hey2 or Hdac1 was detected using anti-Flag or anti-HA antibody. 3 independent experiments. i Co-immunoprecipitation analysis of Flag-HEY2 and endogenous HDAC1 in Adv-Ctrl- and Adv-Hey2-infected NRVMs. 3 independent experiments. j Luciferase activities in 293 T cells that were transfected with pGL3-PGC1A-Fluc, pGL3-ESRRA-Fluc or pGL3-CPT2-Fluc with control pGL3, pGL3-HEY2, pGL3-HDAC1, and pGL3-HEY2 and pGL3-HDAC1 together. The relative flyfire luciferase activity was normalized by Renilla luciferase and calculated as the ratio of each experimental group to the control group. 3 biological replicates. Data presents as mean ± SD, *P < 0.05, **P < 0.01, ****P < 0.0001, Student’s t-test (unpaired, two-tailed). Source data are provided as a Source Data file. |
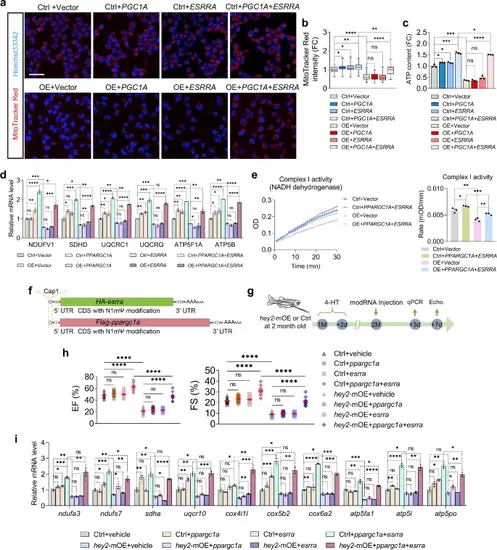
Increased PPARGC1 and ESRRA alleviate mitochondrial and cardiac dysfunction due to Hey2 overexpression.a MitoTracker Red CMXRos staining measuring the mitochondrial mass of control AC16 or HEY2-OE AC16 cells transfected with control vectors, PPARGC1A or ESRRA vectors, as well as PPARGC1A and ESRRA plasmids together. Scale bar: 50 µm. b Quantification of MitoTracker Red fluorescent intensity of transfected HEY2-OE AC16 cells and control AC16 cells. Data were relative to fluorescent intensity in control group. n = 38 (ctrl+vector, OE + PPARGC1A + ESRRA), n = 41 (ctrl+PPARGC1A), n = 39 (ctrl+ESRRA), n = 43 (the rest groups). Box plots displayed median ± interquartile range (IQR), with whiskers extending to the minimum and maximum values. *P < 0.05, **P < 0.01, ****P < 0.0001, Student’s t-test (unpaired, two-tailed). c ATP levels of control AC16 and HEY2-OE AC16 cells transfected with control vectors, PPARGC1A or ESRRA vectors, and PPARGC1A and ESRRA plasmids together. Data were relative to ATP level in control group. 3 biological replicates. d RT-qPCR analysis showing ETC complex genes that expressed in control AC16 and HEY2-OE AC16 cells transfected with control vectors, PPARGC1A or ESRRA vectors, and PPARGC1A and ESRRA plasmids together. 3 biological replicates. e Measurement of mitochondrial ETC complex I activity in control AC16 and HEY2-OE AC16 cells transfected with control vectors, and PPARGC1A and ESRRA plasmids together. 3 biological replicates. f Schematic synthesis diagram of Flag-ppargc1a and HA-esrra mRNA with N1mΨ and Cap analogs modifications. g Experimental diagram for 4-HT treatment, modRNAs injection and cardiac analysis. h Echocardiography analyses depicting EF and FS in hey2-mOE and control hearts injected with vehicle, ppargc1a modRNA, esrra modRNA, or ppargc1a and esrra modRNAs together. n = 10 (hey2-mOE+ppargc1a+esrra), n = 11 (the rest groups). i RT-qPCR analysis showing ETC complex genes that differentially expressed in hey2-mOE and control hearts injected with vehicle, ppargc1a modRNA, esrra modRNA, or ppargc1a and esrra modRNAs together. 3 biological replicates. Data presents as mean ± SEM, *P < 0.05, **P < 0.01, ***P < 0.001, ****P < 0.0001, Student’s t-test (unpaired, two-tailed) (c, e, h) or Multiple t tests (two-tailed) (d, i). Source data are provided as a Source Data file. |
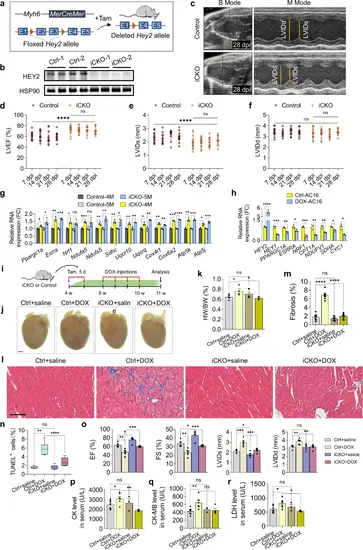
Inducible Hey2 depletion in adult mouse hearts enhances mitochondrial bioenergetics and cardiac function.a Design of induced Hey2 deletion by Myh6-MerCreMer. Tam, tamoxifen. b Western blots analysis of HEY2 in Hey2-iCKO and control hearts. 3 independent experiments. c Representative B-mode and M-mode echocardiography images of Hey2-iCKO and control hearts at 28 days post tamoxifen injection (dpi). d–f Analysis of LVEF, LVIDs and LVIDd of Hey2-iCKO and control hearts from 7 to 28 dpi. Control: n = 15 (7 dpi,14 dpi), n = 13 (21 dpi, 28 dpi). Hey2-iCKO: n = 14 (7 dpi,14 dpi), n = 12 (21 dpi, 28 dpi). Data presents as mean ± SD, ****P < 0.0001, Two-way ANOVA with Tukey multiple comparisons test. g RT-qPCR analysis of Ppargc1a, Esrra, Nrf1 and ETC complex genes in Hey2-iCKO and control hearts. 3 biological replicates. h RT-qPCR analysis of HEY2, PPARGC1 coactivator, ETC complex genes in DOX-treated and untreated AC16 cells. 3 biological replicates. i Diagram for tamoxifen and DOX injections, and hearts analysis in Hey2-iCKO and control mice. j, k Representative whole-mount hearts and quantification of heart weight (HW)/ body weight (BW) ratio from saline-injected control mice (Ctrl+saline, n = 5), DOX-injected control mice (Ctrl+DOX, n = 4), saline-injected Hey2-iCKO mice (iCKO+saline, n = 5) and DOX-injected Hey2-iCKO mice (iCKO+DOX, n = 3). Scale bar: 1000 µm. l, m Masson’s trichrome staining and fibrosis quantification of Ctrl+saline, Ctrl+DOX, iCKO+saline and iCKO+DOX hearts (n = 8 mice). Scale bar: 100 µm. n Quantification of TUNEL+ cells in Ctrl+saline, Ctrl+DOX, iCKO+saline and iCKO+DOX hearts (n = 6 mice). Box plots displayed median ± interquartile range (IQR), with whiskers extending to the minimum and maximum values. **P < 0.01, ****P < 0.0001, Student’s t-test (unpaired, two-tailed). o Analysis of LVEF, LVFS, LVIDs and LVIDd in hearts of Ctrl+saline (n = 5), Ctrl+DOX (n = 6), iCKO+saline (n = 5) and iCKO+DOX (n = 6) groups. p–r The serum levels of CK, CK-MB and LDH in Ctrl+saline (n = 7), Ctrl+DOX (n = 6), iCKO+saline (n = 3) and iCKO+DOX (n = 4) groups. Data presents as mean ± SEM, *P < 0.05, **P < 0.01, ***P < 0.001, ****P < 0.0001, Student’s t-test (unpaired, two-tailed) (k, m, o–r) or Multiple t tests (two-tailed) (g, h). Source data are provided as a Source Data file. |
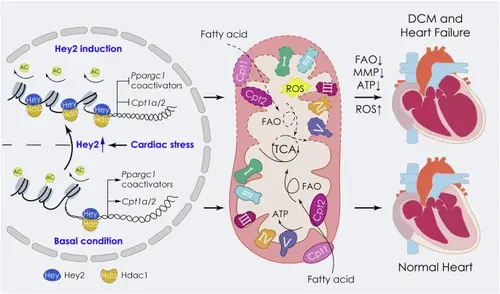
HEY2-mediated energy metabolic gene regulation in adult cardiomyocytes.Hey2 is induced in adult CMs in response to pathological stress (i.e., DCM hearts or DOX treatment). Elevated HEY2 recruits HDAC1 to occupy the promoters of PPARGC1 coactivator complex genes and Cpt1a/Cpt2 regulatory genes to mediate histone deacetylation and transcriptional repression, which results in depressed energy production, ROS increases, cardiac dilation and failure. Under normal conditions, the basal level of HEY2 along with HDAC1 restrains the rampant energy metabolic gene expression to maintain cardiac homeostasis. FAO: fatty-acid oxidation; TCA: tricarboxylic acid cycle; MMP: mitochondrial membrane potential; ROS: reactive oxygen species; I-V: mitochondrial electron transport chain complex I-V; Cpt1, Cpt2: FAO enzyme. |