
Fig. 7
- ID
- ZDB-FIG-250210-38
- Publication
- She et al., 2025 - The transcriptional repressor HEY2 regulates mitochondrial oxidative respiration to maintain cardiac homeostasis
- Other Figures
- All Figure Page
- Back to All Figure Page
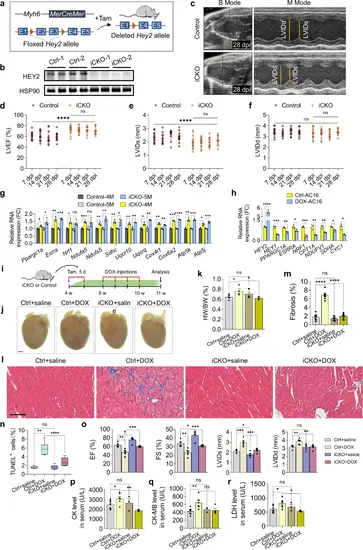
Inducible Hey2 depletion in adult mouse hearts enhances mitochondrial bioenergetics and cardiac function.a Design of induced Hey2 deletion by Myh6-MerCreMer. Tam, tamoxifen. b Western blots analysis of HEY2 in Hey2-iCKO and control hearts. 3 independent experiments. c Representative B-mode and M-mode echocardiography images of Hey2-iCKO and control hearts at 28 days post tamoxifen injection (dpi). d–f Analysis of LVEF, LVIDs and LVIDd of Hey2-iCKO and control hearts from 7 to 28 dpi. Control: n = 15 (7 dpi,14 dpi), n = 13 (21 dpi, 28 dpi). Hey2-iCKO: n = 14 (7 dpi,14 dpi), n = 12 (21 dpi, 28 dpi). Data presents as mean ± SD, ****P < 0.0001, Two-way ANOVA with Tukey multiple comparisons test. g RT-qPCR analysis of Ppargc1a, Esrra, Nrf1 and ETC complex genes in Hey2-iCKO and control hearts. 3 biological replicates. h RT-qPCR analysis of HEY2, PPARGC1 coactivator, ETC complex genes in DOX-treated and untreated AC16 cells. 3 biological replicates. i Diagram for tamoxifen and DOX injections, and hearts analysis in Hey2-iCKO and control mice. j, k Representative whole-mount hearts and quantification of heart weight (HW)/ body weight (BW) ratio from saline-injected control mice (Ctrl+saline, n = 5), DOX-injected control mice (Ctrl+DOX, n = 4), saline-injected Hey2-iCKO mice (iCKO+saline, n = 5) and DOX-injected Hey2-iCKO mice (iCKO+DOX, n = 3). Scale bar: 1000 µm. l, m Masson’s trichrome staining and fibrosis quantification of Ctrl+saline, Ctrl+DOX, iCKO+saline and iCKO+DOX hearts (n = 8 mice). Scale bar: 100 µm. n Quantification of TUNEL+ cells in Ctrl+saline, Ctrl+DOX, iCKO+saline and iCKO+DOX hearts (n = 6 mice). Box plots displayed median ± interquartile range (IQR), with whiskers extending to the minimum and maximum values. **P < 0.01, ****P < 0.0001, Student’s t-test (unpaired, two-tailed). o Analysis of LVEF, LVFS, LVIDs and LVIDd in hearts of Ctrl+saline (n = 5), Ctrl+DOX (n = 6), iCKO+saline (n = 5) and iCKO+DOX (n = 6) groups. p–r The serum levels of CK, CK-MB and LDH in Ctrl+saline (n = 7), Ctrl+DOX (n = 6), iCKO+saline (n = 3) and iCKO+DOX (n = 4) groups. Data presents as mean ± SEM, *P < 0.05, **P < 0.01, ***P < 0.001, ****P < 0.0001, Student’s t-test (unpaired, two-tailed) (k, m, o–r) or Multiple t tests (two-tailed) (g, h). Source data are provided as a Source Data file. |