
|
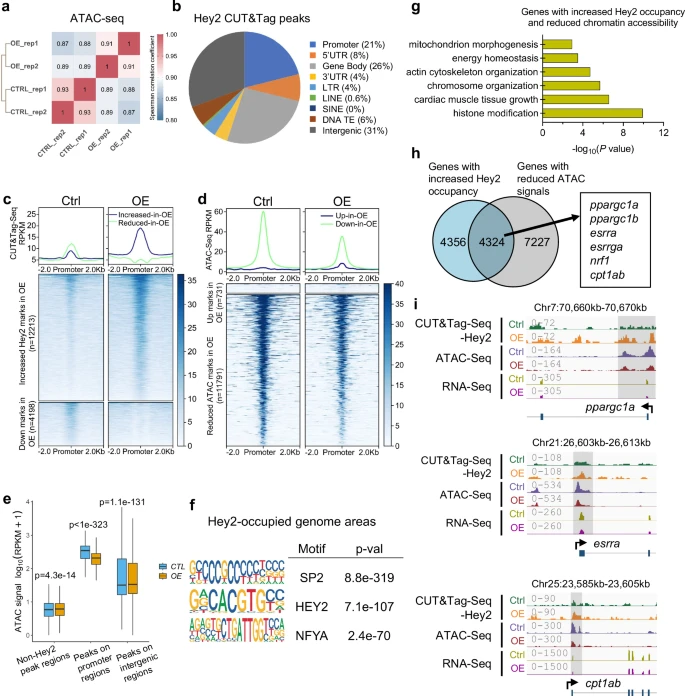
Fig. 4 Hey2 overexpression represses the transcription of Ppargc1 energy coactivator complex genes in zebrafish hearts.a Spearman correlation coefficients analysis showing the correlation between biological replicates of ATAC-seq samples from hey2-mOE and control hearts. Correlation coefficient closer to 1 indicates better agreement. b Pie chart of Hey2 peak distribution determined from whole-genome CUT&Tag sequencing data. Promoter was defined as ± 500 bp from the transcription start site (TSS). c, d Heatmaps of Hey2 CUT&Tag-seq and ATAC-seq signals in hey2-mOE hearts compared to control hearts, using a 2 kb window centered on promoter regions and sorted in descending order by signal intensity. e Boxplot showing ATAC-seq mark signals in the Hey2-occupied promoter regions (n = 6752 regions each group), Hey2-bound intergenic regions (n = 20826 regions each group), and non-Hey2-occupied regions (n = 6752 regions each group) in hey2-mOE hearts and control hearts. Signal intensity is represented by the log10 (RPKM + 1) value of ATAC-seq data. Box plots displayed median ± interquartile range (IQR), with whiskers extending to 1.5*IQR. P value by paired Wilcoxon test. f Top enriched motifs of SP2, HEY2 (E box) and NFYA at Hey2-occupied genome regions. Hey2-occupied areas were defined by peaks called from Hey2 CUT&Tag-seq. Binomial test by “CentriMo” algorithm of software package “MEME Suite”. P value was adjusted by Bonferroni correction. g Bar graph showing -log10 P values for GO categories significantly represented in the overlapped genes with increased Hey2 binding peaks and reduced chromatin accessibility on the promoter regions in hey2-mOE hearts. Hypergeometric test by “enrichGO” function of R package “clusterProfiler”. P value was adjusted by Benjamini-Hochberg correction. h Venn diagram outlining 4324 overlapped genes between genes with increased Hey2 binding (CUT&Tag-seq up) and reduced chromatin accessibility (ATAC-seq down) in hey2-mOE hearts (including ppargc1a, ppargc1b, esrra, esrrga, nrf1 and cpt1ab). i The Genome browser views at loci of ppargc1a, esrra and cpt1ab showing Hey2 CUT&Tag-seq, ATAC-seq, and RNA-seq signals from hey2-mOE and control hearts. The signal values are indicated on the left. 2 biological replicates. Source data are provided as a Source Data file.