
Fig. 3
- ID
- ZDB-FIG-250210-34
- Publication
- She et al., 2025 - The transcriptional repressor HEY2 regulates mitochondrial oxidative respiration to maintain cardiac homeostasis
- Other Figures
- All Figure Page
- Back to All Figure Page
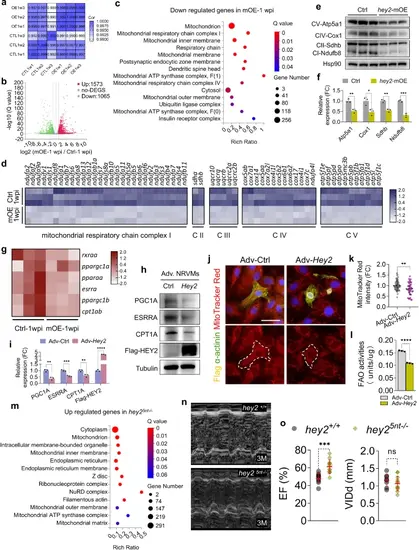
Hey2 preserves cardiac homeostasis by negatively regulating mitochondrial respiration pathways.a Pearson correlation coefficients analysis showing the correlation between biological replicates of aligned RNA-seq data form hey2-mOE and control hearts. Correlation coefficient closer to 1 indicates better agreement. 3 biological replicates. b Volcano plot of expressed genes in hey2-mOE-1 wpi and control hearts. The colored dots were the differentially expressed genes (DEGs). Red: upregulated DEGs, green: downregulated DEGs. The horizontal dot line indicated Q < 0.05. The vertical line indicated fold change of 2. c GO analysis based on cellular component of downregulated genes in the hey2-mOE-1 wpi profile. d Heatmap of expression profile of affected mitochondrial ETC complex I, II, III, IV and V genes in hey2-mOE-1 wpi and control heart (FC > 1.5 and Q < 0.05). e, f Western blots analysis and quantification of ETC complexes in hey2-mOE and control heart at the age of 2 months. 3 biological replicates. g Heatmap of expression profile of master regulators of mitochondria biogenesis in hey2-mOE-1 wpi and control heart (FC > 1.4 and Q < 0.05). h, i Western blots analysis and quantification of PGC1A, ESRRA, CPT1A and Flag-HEY2 protein in Adv-Hey2- and Adv-Ctrl-infected NRVMs. 3 biological replicates. j MitoTracker Red CMXRos (red) staining measuring the mitochondrial mass of Adv-Hey2- and Adv-Ctrl-infected NRVMs. The NRVMs was marked by CM marker α-actinin (green). The anti-Flag antibody showed the nuclear-located HEY2-Flag protein (yellow). Scale bar: 50 µm. k Quantification of MitoTracker Red fluorescent intensity in Adv-Hey2- and Adv-Ctrl-infected NRVMs. Adv-Ctrl: n = 69, Adv-Hey2: n = 38. l Measurement of FAO activities in Adv-Hey2- and Adv-Ctrl-infected NRVMs. 3 biological replicates. m GO analysis based on cellular component of upregulated genes in the hey25nt-/- profile. n Representative long-axis M-mode echocardiography images of hey2+/+ and hey25nt-/- hearts at the age of 3 months. o Echocardiography analysis of EF and VIDd of hey2+/+ and hey25nt-/- hearts. hey2+/+: n = 9, hey25nt-/-: n = 12. Data presents as mean ± SD, *P < 0.05, **P < 0.01, ***P < 0.001, ****P < 0.0001, Student’s t-test (unpaired, two-tailed) (k, l, o) or Multiple t tests (two-tailed) (f, i). Source data are provided as a Source Data file. |