
Fig. 6
- ID
- ZDB-FIG-250210-37
- Publication
- She et al., 2025 - The transcriptional repressor HEY2 regulates mitochondrial oxidative respiration to maintain cardiac homeostasis
- Other Figures
- All Figure Page
- Back to All Figure Page
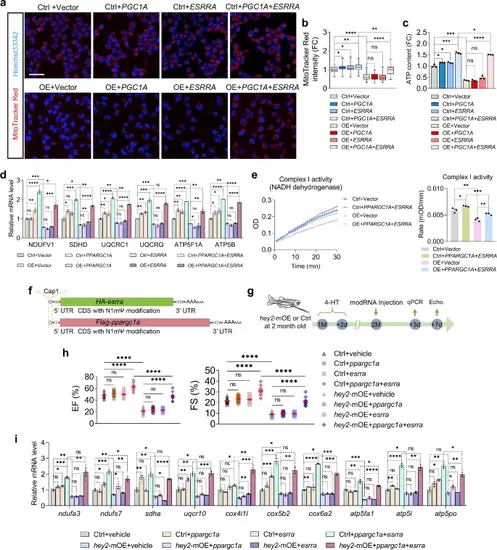
Increased PPARGC1 and ESRRA alleviate mitochondrial and cardiac dysfunction due to Hey2 overexpression.a MitoTracker Red CMXRos staining measuring the mitochondrial mass of control AC16 or HEY2-OE AC16 cells transfected with control vectors, PPARGC1A or ESRRA vectors, as well as PPARGC1A and ESRRA plasmids together. Scale bar: 50 µm. b Quantification of MitoTracker Red fluorescent intensity of transfected HEY2-OE AC16 cells and control AC16 cells. Data were relative to fluorescent intensity in control group. n = 38 (ctrl+vector, OE + PPARGC1A + ESRRA), n = 41 (ctrl+PPARGC1A), n = 39 (ctrl+ESRRA), n = 43 (the rest groups). Box plots displayed median ± interquartile range (IQR), with whiskers extending to the minimum and maximum values. *P < 0.05, **P < 0.01, ****P < 0.0001, Student’s t-test (unpaired, two-tailed). c ATP levels of control AC16 and HEY2-OE AC16 cells transfected with control vectors, PPARGC1A or ESRRA vectors, and PPARGC1A and ESRRA plasmids together. Data were relative to ATP level in control group. 3 biological replicates. d RT-qPCR analysis showing ETC complex genes that expressed in control AC16 and HEY2-OE AC16 cells transfected with control vectors, PPARGC1A or ESRRA vectors, and PPARGC1A and ESRRA plasmids together. 3 biological replicates. e Measurement of mitochondrial ETC complex I activity in control AC16 and HEY2-OE AC16 cells transfected with control vectors, and PPARGC1A and ESRRA plasmids together. 3 biological replicates. f Schematic synthesis diagram of Flag-ppargc1a and HA-esrra mRNA with N1mΨ and Cap analogs modifications. g Experimental diagram for 4-HT treatment, modRNAs injection and cardiac analysis. h Echocardiography analyses depicting EF and FS in hey2-mOE and control hearts injected with vehicle, ppargc1a modRNA, esrra modRNA, or ppargc1a and esrra modRNAs together. n = 10 (hey2-mOE+ppargc1a+esrra), n = 11 (the rest groups). i RT-qPCR analysis showing ETC complex genes that differentially expressed in hey2-mOE and control hearts injected with vehicle, ppargc1a modRNA, esrra modRNA, or ppargc1a and esrra modRNAs together. 3 biological replicates. Data presents as mean ± SEM, *P < 0.05, **P < 0.01, ***P < 0.001, ****P < 0.0001, Student’s t-test (unpaired, two-tailed) (c, e, h) or Multiple t tests (two-tailed) (d, i). Source data are provided as a Source Data file. |