
Fig. 1
- ID
- ZDB-FIG-250210-32
- Publication
- She et al., 2025 - The transcriptional repressor HEY2 regulates mitochondrial oxidative respiration to maintain cardiac homeostasis
- Other Figures
- All Figure Page
- Back to All Figure Page
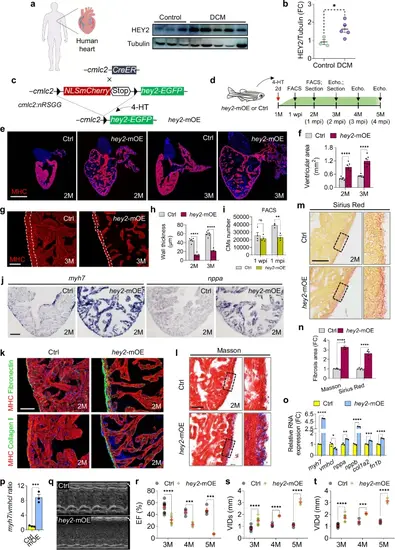
Hey2 upregulation in adult hearts causes cardiac dilation and heart failure.a, b Western blots analysis and quantification of HEY2 in DCM patients and normal human hearts. 3 biological replicates. c Diagram of transgenic zebrafish used for inducible expression of Hey2 in CMs. d Schematic of 4-HT treatment and cardiac analysis for hey2-mOE and Ctrl zebrafish. e, f Section images stained with anti-MHC antibody (red) and quantification of ventricular area of hey2-mOE and Ctrl ventricles at 2 and 3 months. n = 5 (Ctrl), n = 7 (OE). Scale bar: 500 µm. g Immunofluorescence images of anti-MHC antibody in hey2-mOE and Ctrl fish at 3 months old. The dotted line depicts the ventricular wall. Scale bar: 100 µm. h Quantification of ventricular wall thickness of hey2-mOE and Ctrl fish. 2 months: n = 6 (Ctrl), n = 7 (OE). 3 months: n = 6 (Ctrl, OE). i Quantification of CM number of hey2-mOE and Ctrl fish at 1 wpi and 1 mpi by FACS analysis. 1 wpi (4 biological replicates); 1 mpi (3 biological replicates). j ISH analyses of myh7 and nppa expression in hey2-mOE and control ventricles. Scale bar: 100 µm. k Section images of ventricles from hey2-mOE and Ctrl fish. Co-staining: anti-fibronectin (green) and anti-MHC antibodies (red); anti-collagen I (green) and anti-MHC antibodies (red). n = 6 hearts. Scale bar: 50 µm. l, m Masson’s trichrome and Sirius red staining of hey2-mOE and control hearts. Higher-magnification of the dashed boxes (right). Scale bar: 50 µm. n Fibrosis area quantification in hey2-mOE and control hearts. n = 5. o, p RT-qPCR analysis of myh7, vmhcl, nppa, nppb, col1a, fn1b and myh7/vmhcl ratio in hey2-mOE and control hearts. 3 biological replicates. q Representative M-mode echocardiography images of hey2-mOE and control hearts at 3 months old. r–t Analysis of EF, VIDs and VIDd of hey2-mOE and control hearts. 3 months: n = 9 (Ctrl), n = 10 (OE). 4 months: n = 4 (Ctrl, OE). 5 months: n = 4 (Ctrl), n = 3 (OE). Data presents as mean ± SEM, *P < 0.05, **P < 0.01, ***P < 0.001, ****P < 0.0001, Student’s t-test (unpaired, two-tailed) (b, p) or Multiple t tests (two-tailed) (f, h, i, n, o, r–t). 2 months old (j, k, l, m). Source data are provided as a Source Data file. |