
Fig. 4
- ID
- ZDB-FIG-250210-35
- Publication
- She et al., 2025 - The transcriptional repressor HEY2 regulates mitochondrial oxidative respiration to maintain cardiac homeostasis
- Other Figures
- All Figure Page
- Back to All Figure Page
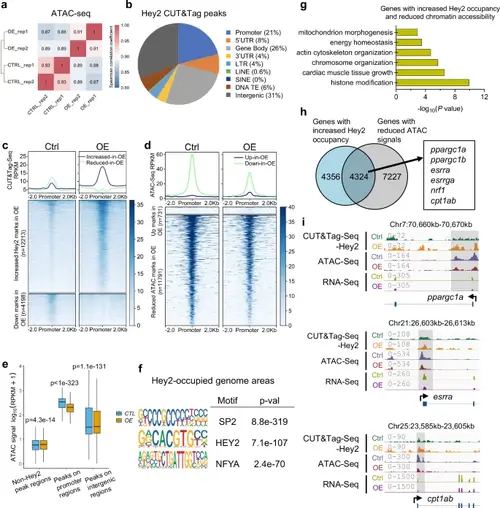
Hey2 overexpression represses the transcription of Ppargc1 energy coactivator complex genes in zebrafish hearts.a Spearman correlation coefficients analysis showing the correlation between biological replicates of ATAC-seq samples from hey2-mOE and control hearts. Correlation coefficient closer to 1 indicates better agreement. b Pie chart of Hey2 peak distribution determined from whole-genome CUT&Tag sequencing data. Promoter was defined as ± 500 bp from the transcription start site (TSS). c, d Heatmaps of Hey2 CUT&Tag-seq and ATAC-seq signals in hey2-mOE hearts compared to control hearts, using a 2 kb window centered on promoter regions and sorted in descending order by signal intensity. e Boxplot showing ATAC-seq mark signals in the Hey2-occupied promoter regions (n = 6752 regions each group), Hey2-bound intergenic regions (n = 20826 regions each group), and non-Hey2-occupied regions (n = 6752 regions each group) in hey2-mOE hearts and control hearts. Signal intensity is represented by the log10 (RPKM + 1) value of ATAC-seq data. Box plots displayed median ± interquartile range (IQR), with whiskers extending to 1.5*IQR. P value by paired Wilcoxon test. f Top enriched motifs of SP2, HEY2 (E box) and NFYA at Hey2-occupied genome regions. Hey2-occupied areas were defined by peaks called from Hey2 CUT&Tag-seq. Binomial test by “CentriMo” algorithm of software package “MEME Suite”. P value was adjusted by Bonferroni correction. g Bar graph showing -log10 P values for GO categories significantly represented in the overlapped genes with increased Hey2 binding peaks and reduced chromatin accessibility on the promoter regions in hey2-mOE hearts. Hypergeometric test by “enrichGO” function of R package “clusterProfiler”. P value was adjusted by Benjamini-Hochberg correction. h Venn diagram outlining 4324 overlapped genes between genes with increased Hey2 binding (CUT&Tag-seq up) and reduced chromatin accessibility (ATAC-seq down) in hey2-mOE hearts (including ppargc1a, ppargc1b, esrra, esrrga, nrf1 and cpt1ab). i The Genome browser views at loci of ppargc1a, esrra and cpt1ab showing Hey2 CUT&Tag-seq, ATAC-seq, and RNA-seq signals from hey2-mOE and control hearts. The signal values are indicated on the left. 2 biological replicates. Source data are provided as a Source Data file. |