
|
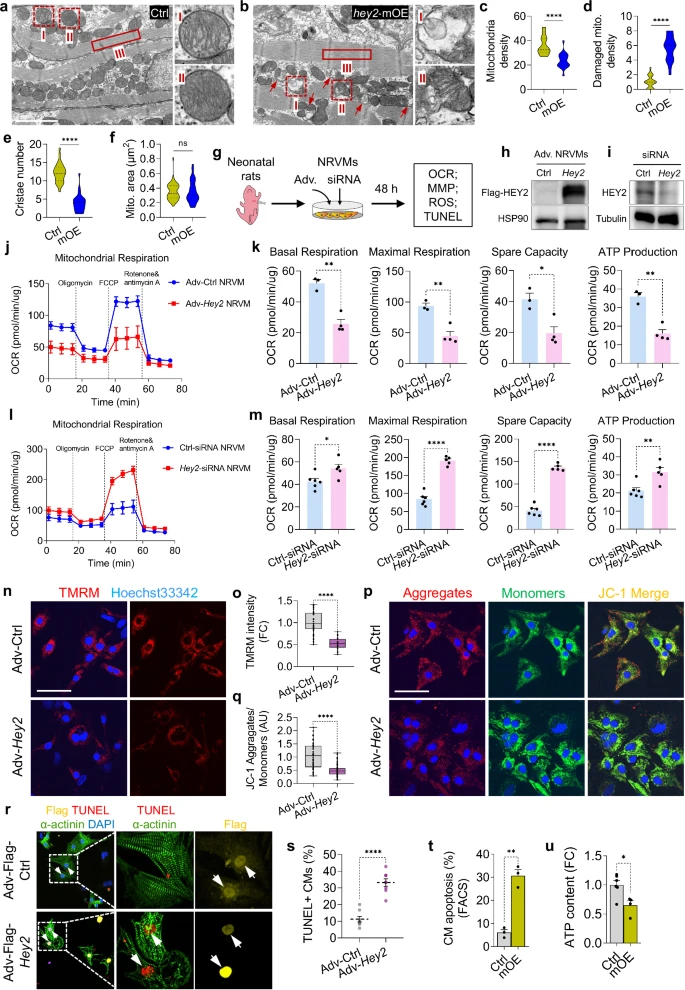
Fig. 2 Induced Hey2 expression in adult CMs impairs mitochondrial biogenesis and respiration.a, b Representative TEM images of 2-month-old hey2-mOE and control hearts. Red arrow: degraded mitochondria. Higher-magnification images of the dashed boxes are shown on the right. Scale bar: 2 µm. c–f Quantifications of mitochondria density, damaged mitochondria density, cristae number and mitochondria (mito) area in hey2-mOE and control hearts. density (mito number per 25 µm2): 20 fields. cristae: 28 mito. area: 50 mito. ****P < 0.0001, Student’s t-test (unpaired, two-tailed). g Diagram of experimental design for OCR, MMP, ROS or TUNEL staining using adenovirus-infected or siRNAs-transfected NRVMs. h Western blots analysis of Flag-HEY2 using anti-Flag antibody in Adv-Hey2- and Adv-Ctrl-infected NRVMs. i Western blots analysis of HEY2 in Ctrl- and Hey2-siRNA-transfected NRVMs. j–m OCR analyses and quantification of basal respiration, maximal respiration, spare respiratory capacity and ATP production in Adv-Hey2- and Adv-Ctrl-infected NRVMs (j, k), as well as in Ctrl- and Hey2-siRNA-transfected NRVMs (l, m). n = 3 (Adv-Ctrl), n = 4 (Adv-Hey2), n = 6 (Ctrl-siRNA), n = 5 (Hey2-siRNA). n, p TMRM (red) staining (n) and JC-1 staining (p) in Adv-Hey2- and Adv-Ctrl-infected NRVMs. JC-1 aggregates (red, polarization), JC-1 monomers (green, depolarization). Scale bar: 50 µm. o Quantification of TMRM fluorescent intensity. Adv-Ctrl: n = 44, Adv-Hey2: n = 18. q Quantification of JC-1 aggregates/monomers ratio. n = 49 (Adv-Ctrl), n = 57 (Adv-Hey2). r TUNEL (red) staining of Adv-Hey2-Flag- and Adv-Flag- (Ctrl) infected NRVMs. α-actinin antibody: NRVMs (green). Flag antibody: infected-adenovirus (yellow). Scale bar: 50 µm. s Apoptosis percentage of Adv-transduced NRVMs. n = 8 fields. t Quantification of CM apoptosis in hey2-mOE and control hearts at 2 months old by FACS analysis. 3 biological replicates. u ATP level in hey2-mOE and control hearts at 2 months old. Ctrl: 6 biological replicates, hey2-mOE: 4 biological replicates. Box plots displayed median ± interquartile range (IQR), with whiskers extending to the minimum and maximum values. ****P < 0.0001, Student’s t-test (unpaired, two-tailed) (o, q). Data presents as mean ± SEM, *P < 0.05, **P < 0.01, ****P < 0.0001, Student’s t-test (unpaired, two-tailed) (k, m, s, t, u). Data presents as mean ± SD (j, l). Source data are provided as a Source Data file.