
- Title
-
Follistatin like-1 (Fstl1) regulates adipose tissue development in zebrafish
- Authors
- Guggeri, L., Sosa-Redaelli, I., Cárdenas-Rodríguez, M., Alonso, M., González, G., Naya, H., Prieto-Echagüe, V., Lepanto, P., Badano, J.L.
- Source
- Full text @ Adipocyte

fstl1a and fstl1b knockdown affect primary cilia formation in early embryos. a) Diagram depicting the partial genomic structure of fstl1a and fslt1b to show the site of morpholino binding (grey bar) to mRNA and the location of primers (arrows) used to evaluate knockdown efficiency. Also, schematic representations of the corresponding protein structures are shown. b) Gel image showing RT-PCR results demonstrating impaired amplification of fstl1a and fstl1b in the MOfstl1a and MOfstl1b morphant embryos, respectively. Gapdh was used as control. c) Low magnification images of 48 hpf wild-type and morphant embryos, and graphs showing the distribution of embryos in distinct phenotypic classes according to severity at the morpholino doses tested. The pooled data from three experiments are presented; the number of embryos analysed in each condition is indicated within brackets. d) Dot plot with the quantification of ciliary length in Kupffer vesicle of 12 somite-stage control and morphant embryos. The pooled data from a single experiment are presented; the total number of cilia measured/number of embryos is indicated in brackets. Plot: individual cilia length values and median ± CI (95%) (*) p < 0.0001; (**) p = 0.0019; Games–Howell test. e) Representative images showing primary cilia (evidenced through acetylated tubulin immunostaining) in the nasal pit and otic vesicle of 48 hpf embryos injected with either 6 ng of control MO, MOfstl1a or MOfstl1b. Phalloidin staining of F-actin was used to delineate the organ. Scale bars: C: 1 mm; E: 10 µm. EXPRESSION / LABELING:
PHENOTYPE:
|

Generation of a fstl1a KO line. a) Diagram depicting the partial genomic structure of fstl1a showing the recognition site of gRNAs at exon 3 (grey bars) and of the generic primers used (arrows) for heteroduplex analysis and sequencing of the region. b) Low magnification images of embryos injected with fstl1a gRNA 1 and 2 showing examples of the distinct phenotypic classes. c) Plot of the percentage of embryos in each of the following phenotypic classes: wild type, dorsal curvature, dorso-ventral defects, severe defects, dead. Data from a single experiment; the total number of embryos is indicated in brackets. d) Gel image showing the amplification (by PCR) of the region flanking the PAM sequence using the generic primers mentioned in (a) from wild-type and Cas9 + gRNA1 injected embryos. e) Sequence alignments of the different mutations found in embryos derived from the cross of F0 individuals and wild types. The dashed rectangle indicates the allele selected for further work. bp: base pairs; ins: insertion; del: deletion; FS: frame shift; PSC: premature stop codon. f) Dot plot showing qPCR results for fstl1a and fstl1b in pooled wild-type and fstl1a KO 48hpf embryos from the third generation. Plot: technical replicates and mean ± CI (95%); NRQ: normalized relative quantity; (*) p = 0,007, t-test. g) Dot plot showing the quantification of the length of primary cilia in Kupffer’s vesicle of 12 somite-stage wild type and fstl1a mutant embryos. The pooled data from a single experiment are presented; the total number of cilia measured/number of embryos is indicated in brackets. Plot: individual length values and median ± CI (95%). (*) p = 3.8 × 10⁻¹⁴, Mann–Whitney test. h) Representative immunofluorescence images showing primary cilia (acetylated tubulin) in the nasal pit and otic vesicle of 48 hpf wild-type and fstl1a KO embryos. Scale bars: B: 1 mm; H: 20 µm. EXPRESSION / LABELING:
PHENOTYPE:
|
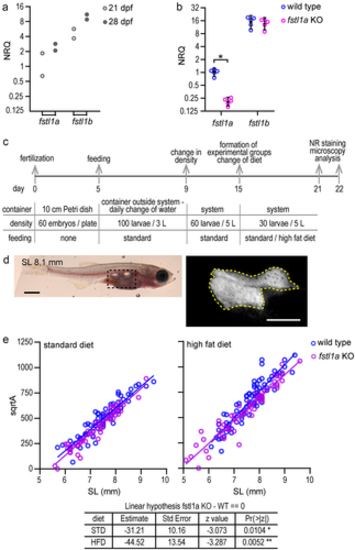
fstl1a KO larvae have less adipose tissue than wild-type larvae. a) Dot plot showing the qPCR results to assess the levels of expression of fstl1a and fstl1b in the isolated abdominal fat deposit of 21 and 28 dpf wild-type larvae (the mean fstl1a level at 21dpf was used as reference; samples from two larvae). b) Dot plot showing the qPCR results for fstl1a and fstl1b in the abdominal region of 21 dpf wild-type and fstl1a KO larvae. Five larvae were analyzed in each condition. Plot: individual NRQ values and mean ± CI (95%). (*) p = 0.012, Mann–Whitney test. c) Schematic representation of the protocol followed to perform the diet experiments. d) Examples of the panoramic bright field and epifluorescence images of Nile Red stained larvae used to quantify the standard length (SL) and extension (area) of adipose tissue. Scale bar: 1 mm (left image); 0.5 mm (right image). e) Dot plots comparing the square root of the area of the adipose tissue vs SL of wild-type and fstl1a KO larvae in standard and high-fat diets. The straight lines are the least squares fit to the pooled data from three experiments. The statistical comparison was made using a linear mixed model fit and Tuckey contrasts (bottom table) (see the complete analysis in Figure S3). EXPRESSION / LABELING:
PHENOTYPE:
|
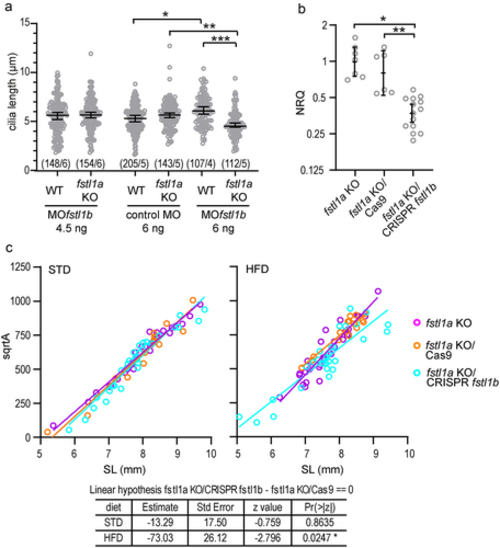
fstl1b compensates fstl1a depletion. a) Dot blot with the analysis of cilia length in Kupffer’s Vesicle of wild-type or fstl1a KO embryos injected with different doses of control or fstl1b morpholino. The pooled data from a single experiment is presented; the total number of cilia measured/number of embryos is indicated in brackets. Plot: individual length values and median ± CI (95%). (*) p = 1.9 × 10⁻⁴; (**) p = 4.2 × 10⁻⁷; (***) p = 2.8 × 10⁻⁹; Mann–Whitney test. b) Dot blot showing the qPCR results assessing the expression level of fstl1b mRNA in fstl1a KO larvae un-injected (seven larvae analysed), injected with Cas9 protein (six larvae analysed) or crispant for fstl1b (14 larvae analysed). Plot: individual NRQ values and mean ± CI (95%). (*) p = 8.9 × 10⁻⁴; (**) p = 0.0034; Mann–Whitney test. c) Dot blot showing the comparison of the square root of the adipose tissue area vs SL of fstl1a KO larvae un-injected, injected with Cas9 protein or crispant for fstl1b, in standard and high-fat diets. The straight lines are least squares fit to the data. The statistical comparison was made using a linear mixed model fit and Tuckey contrasts (bottom table) (see the complete analysis in Figure S3). PHENOTYPE:
|
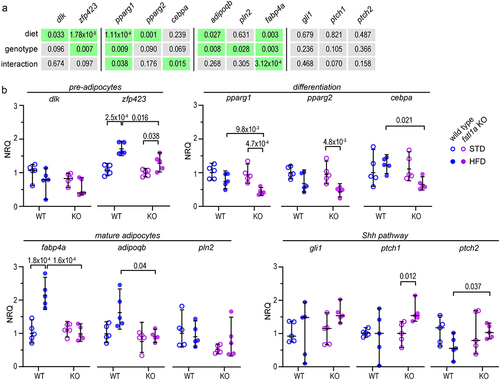
Differentiation and mature adipocyte markers are downregulated in fstl1a KO larvae under high fat diet compared to wild types. a) Table showing the expression analysis for different genes associated with preadipocytes, adipogenesis (differentiation), mature adipocytes, and activation of the Shh signalling pathway. qPCR results were analysed using a two-way ANOVA to evaluate the effect of diet and genotype on the expression of the different genes. The table indicates the p-values of the simple main effect analysis and the interaction between diet and genotype for each gene. b) Dot plots with the individual NRQ values and the mean ± CI95% of mRNA for different preadipocyte (dlk1, zfp423), differentiation (pparg1, pparg2, cebpa) and mature adipocyte (fabp4a, adipoqb, pln2) marker genes, as well as genes indicative of Shh pathway activation (gli1, ptch1, ptch2) in the abdominal region of wild-type (WT; blue) or fstl1a KO (KO; magenta) larvae under standard (○; empty circle) or high fat diet (●; full circle). Five larvae from one diet experiment were analysed in each condition. Significative pairwise differences are indicated with their p-values (Tuckey post-hoc test). EXPRESSION / LABELING:
PHENOTYPE:
|