
Fig. 4
- ID
- ZDB-IMAGE-250110-33
- Publication
- Guggeri et al., 2024 - Follistatin like-1 (Fstl1) regulates adipose tissue development in zebrafish
- All Figures
- Figures for Guggeri et al., 2024
|
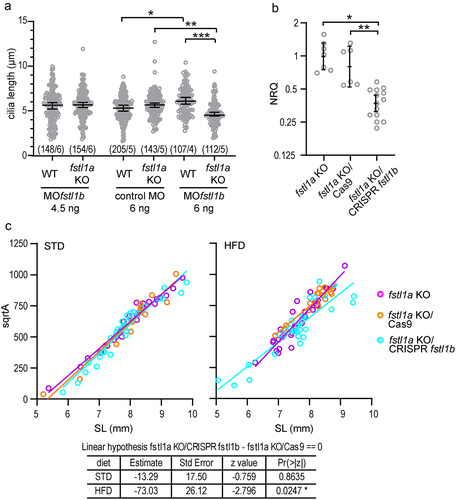
Fig. 4 fstl1b compensates fstl1a depletion. a) Dot blot with the analysis of cilia length in Kupffer’s Vesicle of wild-type or fstl1a KO embryos injected with different doses of control or fstl1b morpholino. The pooled data from a single experiment is presented; the total number of cilia measured/number of embryos is indicated in brackets. Plot: individual length values and median ± CI (95%). (*) p = 1.9 × 10⁻⁴; (**) p = 4.2 × 10⁻⁷; (***) p = 2.8 × 10⁻⁹; Mann–Whitney test. b) Dot blot showing the qPCR results assessing the expression level of fstl1b mRNA in fstl1a KO larvae un-injected (seven larvae analysed), injected with Cas9 protein (six larvae analysed) or crispant for fstl1b (14 larvae analysed). Plot: individual NRQ values and mean ± CI (95%). (*) p = 8.9 × 10⁻⁴; (**) p = 0.0034; Mann–Whitney test. c) Dot blot showing the comparison of the square root of the adipose tissue area vs SL of fstl1a KO larvae un-injected, injected with Cas9 protein or crispant for fstl1b, in standard and high-fat diets. The straight lines are least squares fit to the data. The statistical comparison was made using a linear mixed model fit and Tuckey contrasts (bottom table) (see the complete analysis in Figure S3).