
- Title
-
Her9 controls the stemness properties of hindbrain boundary cells
- Authors
- Engel-Pizcueta, C., Hevia, C.F., Voltes, A., Livet, J., Pujades, C.
- Source
- Full text @ Development

her9 is temporarily enriched in the hindbrain boundaries independently of Notch at early embryonic stages. (A-J) her9 in situ hybridization with rfng (A′,A″) and her4 (F′,F″,G-J) at the indicated developmental stages. (G-J) Embryos treated with DMSO (G,I) or LY411575 (H,J) (18-24 hpf: n=4/4 DMSO versus n=14/14 LY411575; 26-32 hpf: DMSO n=10/10 versus LY411575 n=8/9). (A-A″,B-E,F-F″,C-J) Dorsal maximal intensity projections of the hindbrain with anterior to the left. (a-a″,b-e,f-f″,g-j) Transverse views of r4/r5 boundary or r4. Arrowheads indicate the position of the hindbrain boundaries. Dotted lines delimitate the contour of the neural tube. Dashed vertical lines indicate the levels of the corresponding transverse projections in other panels. hpf, hours post fertilization; r, rhombomere; rl, rhombic lip. Scale bars: 50 µm. EXPRESSION / LABELING:
PHENOTYPE:
|
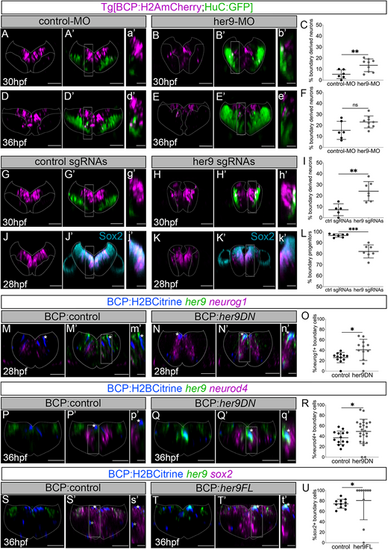
Her9 maintains boundary cells as progenitors, preventing them from engaging in neurogenesis. (A,B,D,E,A′,B′,D′,E′) Tg[BCP:H2AmCherry;HuC:GFP] embryos in which boundary cell nuclei are labeled with magenta and neurons in green have been injected with control-MO (A,A′,D,D′) or her9-MO (B,B′,E,E′) and analyzed at the indicated times. (C,F) Plots displaying the percentage of boundary-derived neurons (30 hpf: control-MO 5.3±4% n=6 versus her9-MO 13.5±5.7% n=9, **P=0.007; 36 hpf: control-MO 15.5±8.2% n=6 versus her9-MO 23.1±5.5% n=9, P=0.08). (G,H,J,K,G′,H′,J′,K′) Tg[BCP:H2AmCherry;HuC:GFP] embryos in which boundary cell nuclei are labeled with magenta and neurons in green have been injected with control sgRNAs (G,G′,J,J′) or her9 sgRNAs (H,H′,K,K′) and analyzed at 30 hpf or immunostained with Sox2 at 28 hpf. (I,L) Plots displaying the percentage of boundary-derived neurons at 30 hpf (control sgRNAs 7.2±5.4% n=5 versus her9 sgRNAs 24.1±8.8% n=7 embryos, **P=0.002) or boundary progenitors at 28 hpf (control sgRNAs 96.6±1.5% n=7 versus her9 sgRNAs 82.1±6% n=7, ***P=0.0005). (M-T,M′-T′) Tg[BCP:Gal4] embryos injected with H2Bcitrine:UAS (M,M′,P,P′,S,S′), H2Bcitrine:UAS:her9DN (N,N′,Q,Q′) or H2Bcitrine:UAS:her9FL (T,T′) and in situ hybridized with her9 and neurog1 (M,N,M′,N′), neurod4 (P,Q,P′,Q′), or sox2 (S,T,S′,T′) probes at the indicated times. (O,R,U) Plots of the percentage of boundary cells expressing neurog1 [control: 26.1±9.8% (of 33±17.5 cells), n=12 boundaries, N=6 embryos; her9DN: 40.8±20.4% (of 16±10.1 cells), n=12 boundaries, N=7 embryos, *P=0.038]; neurod4 [control: 37.1±12.9% (of 29±8.7 cells), n=14 boundaries, N=4 embryos; her9DN: 49.2±23.4% (of 11±5.6 cells), n=24 boundaries, N=7 embryos; *P=0.046]; or sox2 [control: 74.5±8.5% (of 31±11.7 cells), n=11 boundaries, N=4 embryos; her9FL: 80.7±36.9% (of 5±4.9 cells), n=10 boundaries, N=5 embryos; *P=0.026]. All plots show mean±s.d. Welch's test was performed in all comparisons except for the data shown in U, which was analyzed by Mann–Whitney. All transverse views of r4/r5 except for r3/r4 in S,T,S′,T′. (a′-t′) Magnifications of the framed regions in A′–T′. Dotted lines delimitate the contour of the neural tube. BCP, boundary cell population; hpf, hours post-fertilization; MO, morpholino; ns, not significant. Scale bars: 50 µm (main panels); 20 µm (magnifications). |

Multicolor clonal analysis of boundary cells. (A) Scheme depicting the experimental design to label and trace the lineage of multiple boundary progenitors. Tg[BCP:Gal4] embryos at the one-cell stage were injected with Cre protein and the UAS:zebrabow1.0 construct, which contains the fluorescent genes dTomato, mCerulean, and eYFP. Hindbrains were imaged from t0 (32 hpf) to tf (45 hpf). (B,C,b,c) Dorsal and transverse projections through r4/r5 at 32 hpf and 45 hpf. Arrowheads indicate the position of the hindbrain boundaries. Dotted line delimitates the contour of the neural tube. Scale bars: 50 μm. See Movie 1. (D) Proliferative capacity of boundary progenitors (53% dividing (D) versus 47% non-dividing (ND), n=90]. (E) Fate of boundary cell derivatives at 45 hpf: 70% were progenitors (P), and 30% neurons (N) (n=138 tracked cells). (F) Number of cells per clone at 32 hpf and 45 hpf; (t0, 2.1±0.5 cells; tf, 3.1±1 cells; n=44 clones). Images show examples of non-dividing (white outlined circles) and dividing (black outlined circles). (G) Graph showing the cell division modes of boundary progenitors (n=48 cells): symmetric proliferative (PP, 40%), asymmetric (PN, 58%), and symmetric neurogenic (NN, 2%). Images show examples of PP and PN divisions of two-cell clones. (H) Plot showing the percentage of boundary cells displaying PP (orange) or PN (turquoise) division mode over time (PP, 19 cells; PN, 28 cells; n=44 clones). Linear regression lines for PP [R2=0.002; P=0.9 (not significant) and for PN (R2=0.004; P=0.8 (not significant)] tend to zero. (I,J) Clonal analysis of the proliferative capacity of sister cells and their cell division synchrony, respectively. Percentage of clones in which sisters display the same (S; 63%) or different (D; 37%) proliferative behavior (n=44 clones); and dividing boundary clones with sister cells displaying synchronic (S; 13%) or asynchronic (AS, 87%) cell divisions (n=15 clones). (K) Hours between cell division of sister cells (2.8±1.9 h, n=17 sister cells, 15 clones). (L) Clonal analysis of the cell division mode of sister cells. Percentage of dividing boundary clones with sister cells displaying the same (S; 50%) or different (D; 50%) division mode (n=18 clones). (M) Examples of sister cells displaying the same (PN, PN) or different (PP, PN) division mode. In the top row, both the brown and the blue cell lineage display PN divisions, the first at 34.5 hpf and the second at 37 hpf. In the bottom row, both cells divide at 34.5 hpf, the cell from the magenta lineage undergoes a PN, and the blue one a PP division. All clone images show transverse projections with dorsal to the top. Cell centers are circled and color-coded according to their lineage. Dotted lines demarcate the ventricular zone (VZ) and the mantle zone (MZ) at 32 hpf and 45 hpf. N=4 embryos. Scatter plots show the mean±s.d. BCP, boundary cell population; hpf, hours post-fertilization. Scale bars: 20 µm. |

Her9 controls the fate and behavior of boundary cells. (A) Scheme depicting the experimental design. Tg[BCP:Gal4] embryos at the one-cell stage were injected with Cre protein and the UAS:her9DN-zebrabow2.0 or the UAS:her9FL-zebrabow2.0 constructs to conditionally modulate Her9 in the boundary cells. Transgenes contain the YFP, mTurquoise, and tdTomato genes, and tdTomato-labeled clones co-express either with her9DN or her9FL in the context of the non-red, wild-type clones. For color analysis, hindbrains were imaged at 36 hpf and 48 hpf. The clones were then analyzed for color, cell fate, and cell division mode. (B,C) Boundary cell fate upon her9 loss (LOF) or gain (GOF) of function at 48 hpf. Violin plots show the percentage of neurons (B) or progenitors (C) in boundary control clones and upon her9DN or her9FL expression, respectively. (B) 43.4±33% of neurons in control clones (median=45%) versus 78.9±33.7% in her9DN clones (median=100%); **P=0.003. (C) 53.8±26.7% of progenitors in control clones (median=50%) versus 92.9±18.9% in her9FL clones (median=100%); **P=0.008. (D) Boundary cell division mode in her9 LOF at 48 hpf. Violin plots show the percentage of PP (left), PN (middle), and NN (right) divisions [PP: 57.4±27.8% in control clones (median=50%), 28.6±37.7% in her9DN clones (median=0%), **P=0.007; PN: 37±25.5% in control clones (median=45%), 21.4±32.1% in her9DN clones (median=0%), P=0.06; NN: 5.6±23.6% in control clones (median=0%), 50±47.5% in her9DN clones (median=50%), **P=0.001]. (E) Boundary cell division mode in her9 GOF at 48 hpf. Violin plots show the percentage of PP (left), PN (middle), and NN (right) divisions (PP: 45.5±30.7% in control clones (median=33.3%), 90.5±25.2% in her9FL clones (median=100%), **P=0.009; PN: 54.6±30.7% in control clones (median=66.7%), 9.5±25.2% in her9FL clones (median=0%), **P=0.009; NN: 0% in control clones (median=0%), 0% in her9FL clones (median=0%), P>0.9). Violin plots display the median in black. (F,G) Analysis of clonal cell growth upon her9 LOF and GOF at 36 and 48 hpf. Plots show the number of cells per clone in each condition (mean±s.d.): LOF: 3.7±1.2 in control versus 2.7±1.1 in her9DN clones at 36 hpf, **P=0.003; 4.3±1.3 in control versus 3.2±1.4 in her9DN clones at 48 hpf, *P=0.016. GOF: 4.1±1.4 in control versus 3.5±0.8 in her9FL clones at 36 hpf, P=0.187; 4.9±1.3 in control versus 3.1±1.1 in her9FL clones at 48 hpf, **P=0.008. 36 hpf: n=21 control clones, n=20 her9DN clones (12 embryos); 48 hpf: n=18 control clones, n=19 her9DN clones (15 embryos). 36 hpf: n=17 control clones, n=17 her9FL clones (13 embryos); 48 hpf: n=11 control clones, n=7 her9FL clones (15 embryos). Mann–Whitney test was performed in all comparisons. Images show transverse projections of control, her9DN, or her9FL boundary clones with dorsal to the top. Dotted lines demarcate the ventricular zone (VZ) and the mantle zone (MZ) as depicted in A. White circles in the images indicate cell centers. BCP, boundary cell population; hpf, hours post-fertilization; PP, progenitor-progenitor division; PN, progenitor-neuron division; NN, neuron-neuron division; ns, not significant. Scale bars: 20 µm. |

Her9 controls boundary cell proliferation through cdkn1ca. (A,B,D,E,G,H,J,K) Transverse views of Tg[BCP:H2BGFP] embryos injected with control-MO and her9-MO, displaying boundary nuclei and EdU incorporation to detect S-phase cells (G,H,J,K) at the indicated stages. (C,F) Plots displaying the total number of boundary cells in r4/r5 (28 hpf: control-MO 66.8±16 n=15 versus her9-MO 50.28±12.3 n=18, **P=0.0029, Welch's test; 36 hpf: control-MO 84±17.6 n=6 versus her9-MO 49.5±16.5 n=10, **P=0.003, Welch's test). (I,L) Plots showing the percentage of S-phase boundary cells in r4/r5 (28 hpf: control-MO 64.3±4.5% n=13 versus her9-MO 57.4±9.5% n=11, *P=0.042, Welch's test; 36 hpf: control-MO 43.5±12.3% n=12 versus her9-MO 46.17±16.9% n=9, P=0.695, Welch's test). (M,N,M′,N′) Dorsal views of Tg[BCP:GFP] embryos at the indicated stages in situ hybridized with cdkn1ca and her9 probes. (O,P) Dorsal views of Tg[BCP:H2BGFP] embryos injected with control-MO or her9-MO and in situ hybridized with cdkn1ca probe at 28 hpf. (Q) Plot displaying the percentage of boundary cells expressing cdkn1ca (4.1±4.3% in control-MO n=6 versus 13.2±5.1% in her9-MO n=6, **P=0.009, Mann–Whitney test). (m-p,m′,n′) Transverse views of dorsal views displayed in M-P,M′,N′. The plots show mean±s.d. Dotted lines delimitate the contour of the neural tube. Arrowheads indicate the position of the hindbrain boundaries. BCP, boundary cell population; hpf, hours post-fertilization; MO, morpholino; ns, not significant. Scale bars: 50 µm. |

Cyclin D1 and Her9 control the proliferation of boundary cells. (A-D) Tg[BCP:GFP] embryos at the indicated stages were in situ hybridized with ccnd1 and cdkn1ca or her9 probes. (E,F) Tg[BCP:H2BGFP;ccnd1+/+] and Tg[BCP:H2BGFP;ccnd1pfu1/pfu1] embryos displaying boundary cells in green at 26 hpf . (G) Plot showing the number of boundary cells (87.3±16.5 in ccnd1+/+ n=4 versus 61.3±10.8 in ccnd1pfu1/pfu1 n=8; *P=0.04, Welch's test). (H-K) Tg[BCP:H2BGFP;ccnd1+/+] and Tg[BCP:H2BGFP;ccnd1pfu1/pfu1] embryos injected with control-MO (H,I) or her9-MO (J,K). (L) Plot showing the number of boundary cells in Tg[BCP:H2BGFP;ccnd1+/+] and Tg[BCP:H2BGFP;ccnd1pfu1/pfu1] embryos upon different conditions. (H) 75.7±15.9 in ccnd1+/+ control-MO n=3; (I) 44.7±19.4 in ccnd1pfu1/pfu1 control-MO n=3; (J) 46.8±7.7 in ccnd1+/+ her9-MO n=6; (K) 46.5±16.1 in ccnd1pfu1/pfu1 her9-MO n=6. H versus I, *P=0.04; H versus J, *P=0.03; H versus K, *P=0.03; I versus J, P=0.99; I versus K, P=0.99; J versus K, P>0.99. One-way ANOVA, Dunnett's multiple comparison test. Images are transverse views of the r4/r5 boundary (E,F,H-K,a-d) or dorsal maximum intensity projections of the hindbrain with anterior to the left (A-D). The plots show mean±s.d. Dotted lines delimitate the contour of the neural tube. Arrowheads indicate the position of the hindbrain boundaries. BCP, boundary cell population; hpf, hours post-fertilization; MO, morpholino; ns, not significant. Scale bars: 50 µm. |

her9 is expressed in hindbrain progenitor populations at late embryonic stages. (A-A″,B-B″) Tg[BCP:H2BGFP] in situ hybridized with her9 and sox2 (A′) or fabp7a (B,B′) probes at the indicated stages. Arrowheads indicate the position of the hindbrain boundaries. (D-D″) Embryos at 72 hpf hybridized with her9 and fabp7a probes and immunostained with anti-pH3. (C,F-F′) Tg[BCP:H2BGFP] embryos at the indicated stages assayed for EdU incorporation to detect cells in S phase (n=6/6 at 48 hpf and n=5/5 at 72 hpf). Turquoise and red arrowheads indicate the position of mitotic or proliferating cells in lateral and medial domains, respectively. (A-F,A′-F′,A″,D″) Dorsal maximum intensity projections of the hindbrain with anterior to the left. (E,G) Plots showing the number of mitotic cells or S-phase cells in her9-expressing domains (E: 8±3.5 cells in the medial versus 6±2.5 cells in the lateral domain, n=9; G: 63.8±7.9 cells in the medial versus 44.8±11.1 cells in the lateral domain, n=5]. (H) Plot showing the percentage of S-phase cells in hindbrain domains (23.7±5.6% in the her9-expressing lateral versus 34.5±8% in her9-expressing medial versus 41.9±10.5% in the her9-negative domain, n=5). (I,J) Embryos treated with DMSO or LY411575 from 60 hpf to 72 hpf, and in situ hybridized with her9 probe (DMSO n=7/7; LY411575 n=6/6). (K-N) Embryos injected with control-MO and her9-MO, and in situ hybridized with sox2 probe or immunostained with anti-Sox2 at 72 hpf. Note that sox2 expression domain (K-M) was decreased in the her9-MO embryo (L, n=6/7; N, n=8/9) compared to the control (K, n=7/7; M, n=8/8). (a-a″,b-b′,c,d-d′,f-f′,I-N) Transverse projections of r4/r5 boundary. Asterisks indicate the position of the her9-expressing lateral domains. Dotted line delimitates the contour of the neural tube. BCP, boundary cell population; hpf, hours post-fertilization; MO, morpholino. Scale bars: 50 µm. EXPRESSION / LABELING:
PHENOTYPE:
|
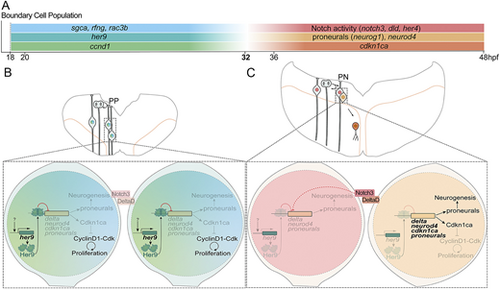
The strategy of stemness maintenance and expansion of hindbrain boundary cells. (A) Scheme of temporal gene expression in the boundary cell population before and after 32 hpf. (B,C) Scheme depicting transverse representations of the hindbrain boundaries before and after 32 hpf. Magnifications of cells (bottom) displaying the mechanisms of Her9 action. Before 32 hpf (B), Her9 inhibits neurogenic genes and cell cycle genes, such as cdkn1ca, keeping boundary cells as progenitors dividing symmetric proliferative. Upon her9 decline (C), Notch3/DeltaD trigger asymmetric divisions. One cell is kept as a progenitor through Notch3 activity, whereas the other cell expresses both neurogenic genes and cdkn1ca, promoting neurogenesis and cell cycle exit. |