
|
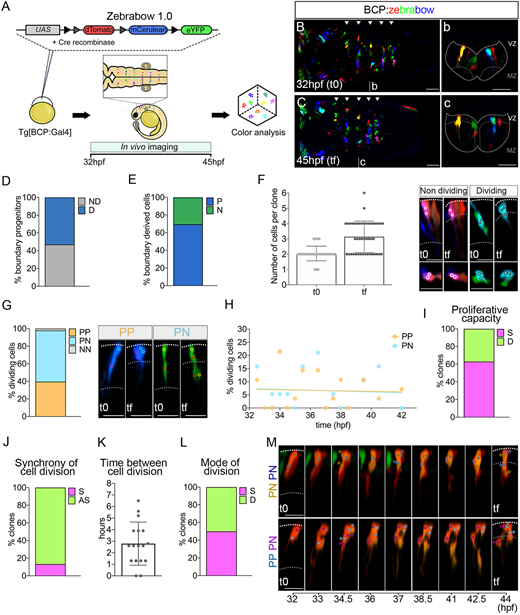
Fig. 3 Multicolor clonal analysis of boundary cells. (A) Scheme depicting the experimental design to label and trace the lineage of multiple boundary progenitors. Tg[BCP:Gal4] embryos at the one-cell stage were injected with Cre protein and the UAS:zebrabow1.0 construct, which contains the fluorescent genes dTomato, mCerulean, and eYFP. Hindbrains were imaged from t0 (32 hpf) to tf (45 hpf). (B,C,b,c) Dorsal and transverse projections through r4/r5 at 32 hpf and 45 hpf. Arrowheads indicate the position of the hindbrain boundaries. Dotted line delimitates the contour of the neural tube. Scale bars: 50 μm. See Movie 1. (D) Proliferative capacity of boundary progenitors (53% dividing (D) versus 47% non-dividing (ND), n=90]. (E) Fate of boundary cell derivatives at 45 hpf: 70% were progenitors (P), and 30% neurons (N) (n=138 tracked cells). (F) Number of cells per clone at 32 hpf and 45 hpf; (t0, 2.1±0.5 cells; tf, 3.1±1 cells; n=44 clones). Images show examples of non-dividing (white outlined circles) and dividing (black outlined circles). (G) Graph showing the cell division modes of boundary progenitors (n=48 cells): symmetric proliferative (PP, 40%), asymmetric (PN, 58%), and symmetric neurogenic (NN, 2%). Images show examples of PP and PN divisions of two-cell clones. (H) Plot showing the percentage of boundary cells displaying PP (orange) or PN (turquoise) division mode over time (PP, 19 cells; PN, 28 cells; n=44 clones). Linear regression lines for PP [R2=0.002; P=0.9 (not significant) and for PN (R2=0.004; P=0.8 (not significant)] tend to zero. (I,J) Clonal analysis of the proliferative capacity of sister cells and their cell division synchrony, respectively. Percentage of clones in which sisters display the same (S; 63%) or different (D; 37%) proliferative behavior (n=44 clones); and dividing boundary clones with sister cells displaying synchronic (S; 13%) or asynchronic (AS, 87%) cell divisions (n=15 clones). (K) Hours between cell division of sister cells (2.8±1.9 h, n=17 sister cells, 15 clones). (L) Clonal analysis of the cell division mode of sister cells. Percentage of dividing boundary clones with sister cells displaying the same (S; 50%) or different (D; 50%) division mode (n=18 clones). (M) Examples of sister cells displaying the same (PN, PN) or different (PP, PN) division mode. In the top row, both the brown and the blue cell lineage display PN divisions, the first at 34.5 hpf and the second at 37 hpf. In the bottom row, both cells divide at 34.5 hpf, the cell from the magenta lineage undergoes a PN, and the blue one a PP division. All clone images show transverse projections with dorsal to the top. Cell centers are circled and color-coded according to their lineage. Dotted lines demarcate the ventricular zone (VZ) and the mantle zone (MZ) at 32 hpf and 45 hpf. N=4 embryos. Scatter plots show the mean±s.d. BCP, boundary cell population; hpf, hours post-fertilization. Scale bars: 20 µm.