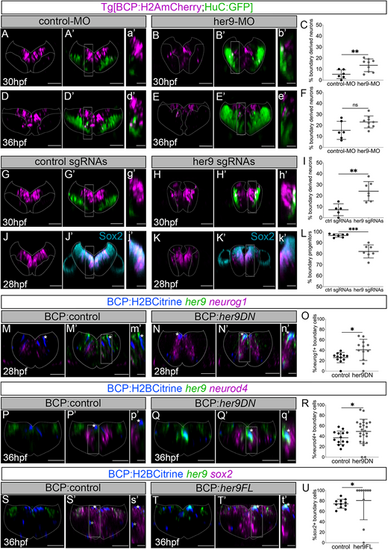
Her9 maintains boundary cells as progenitors, preventing them from engaging in neurogenesis. (A,B,D,E,A′,B′,D′,E′) Tg[BCP:H2AmCherry;HuC:GFP] embryos in which boundary cell nuclei are labeled with magenta and neurons in green have been injected with control-MO (A,A′,D,D′) or her9-MO (B,B′,E,E′) and analyzed at the indicated times. (C,F) Plots displaying the percentage of boundary-derived neurons (30 hpf: control-MO 5.3±4% n=6 versus her9-MO 13.5±5.7% n=9, **P=0.007; 36 hpf: control-MO 15.5±8.2% n=6 versus her9-MO 23.1±5.5% n=9, P=0.08). (G,H,J,K,G′,H′,J′,K′) Tg[BCP:H2AmCherry;HuC:GFP] embryos in which boundary cell nuclei are labeled with magenta and neurons in green have been injected with control sgRNAs (G,G′,J,J′) or her9 sgRNAs (H,H′,K,K′) and analyzed at 30 hpf or immunostained with Sox2 at 28 hpf. (I,L) Plots displaying the percentage of boundary-derived neurons at 30 hpf (control sgRNAs 7.2±5.4% n=5 versus her9 sgRNAs 24.1±8.8% n=7 embryos, **P=0.002) or boundary progenitors at 28 hpf (control sgRNAs 96.6±1.5% n=7 versus her9 sgRNAs 82.1±6% n=7, ***P=0.0005). (M-T,M′-T′) Tg[BCP:Gal4] embryos injected with H2Bcitrine:UAS (M,M′,P,P′,S,S′), H2Bcitrine:UAS:her9DN (N,N′,Q,Q′) or H2Bcitrine:UAS:her9FL (T,T′) and in situ hybridized with her9 and neurog1 (M,N,M′,N′), neurod4 (P,Q,P′,Q′), or sox2 (S,T,S′,T′) probes at the indicated times. (O,R,U) Plots of the percentage of boundary cells expressing neurog1 [control: 26.1±9.8% (of 33±17.5 cells), n=12 boundaries, N=6 embryos; her9DN: 40.8±20.4% (of 16±10.1 cells), n=12 boundaries, N=7 embryos, *P=0.038]; neurod4 [control: 37.1±12.9% (of 29±8.7 cells), n=14 boundaries, N=4 embryos; her9DN: 49.2±23.4% (of 11±5.6 cells), n=24 boundaries, N=7 embryos; *P=0.046]; or sox2 [control: 74.5±8.5% (of 31±11.7 cells), n=11 boundaries, N=4 embryos; her9FL: 80.7±36.9% (of 5±4.9 cells), n=10 boundaries, N=5 embryos; *P=0.026]. All plots show mean±s.d. Welch's test was performed in all comparisons except for the data shown in U, which was analyzed by Mann–Whitney. All transverse views of r4/r5 except for r3/r4 in S,T,S′,T′. (a′-t′) Magnifications of the framed regions in A′–T′. Dotted lines delimitate the contour of the neural tube. BCP, boundary cell population; hpf, hours post-fertilization; MO, morpholino; ns, not significant. Scale bars: 50 µm (main panels); 20 µm (magnifications).
|
