
Fig. 5
- ID
- ZDB-IMAGE-250206-25
- Genes
- Publication
- Engel-Pizcueta et al., 2024 - Her9 controls the stemness properties of hindbrain boundary cells
- All Figures
- Figures for Engel-Pizcueta et al., 2024
|
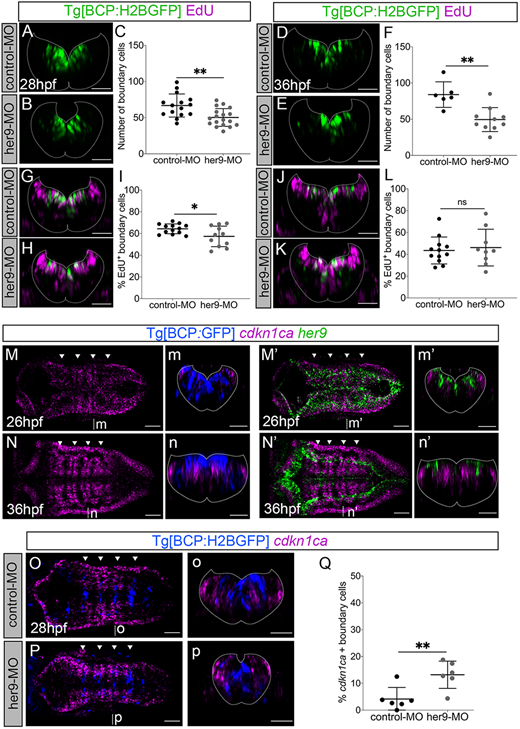
Fig. 5 Her9 controls boundary cell proliferation through cdkn1ca. (A,B,D,E,G,H,J,K) Transverse views of Tg[BCP:H2BGFP] embryos injected with control-MO and her9-MO, displaying boundary nuclei and EdU incorporation to detect S-phase cells (G,H,J,K) at the indicated stages. (C,F) Plots displaying the total number of boundary cells in r4/r5 (28 hpf: control-MO 66.8±16 n=15 versus her9-MO 50.28±12.3 n=18, **P=0.0029, Welch's test; 36 hpf: control-MO 84±17.6 n=6 versus her9-MO 49.5±16.5 n=10, **P=0.003, Welch's test). (I,L) Plots showing the percentage of S-phase boundary cells in r4/r5 (28 hpf: control-MO 64.3±4.5% n=13 versus her9-MO 57.4±9.5% n=11, *P=0.042, Welch's test; 36 hpf: control-MO 43.5±12.3% n=12 versus her9-MO 46.17±16.9% n=9, P=0.695, Welch's test). (M,N,M′,N′) Dorsal views of Tg[BCP:GFP] embryos at the indicated stages in situ hybridized with cdkn1ca and her9 probes. (O,P) Dorsal views of Tg[BCP:H2BGFP] embryos injected with control-MO or her9-MO and in situ hybridized with cdkn1ca probe at 28 hpf. (Q) Plot displaying the percentage of boundary cells expressing cdkn1ca (4.1±4.3% in control-MO n=6 versus 13.2±5.1% in her9-MO n=6, **P=0.009, Mann–Whitney test). (m-p,m′,n′) Transverse views of dorsal views displayed in M-P,M′,N′. The plots show mean±s.d. Dotted lines delimitate the contour of the neural tube. Arrowheads indicate the position of the hindbrain boundaries. BCP, boundary cell population; hpf, hours post-fertilization; MO, morpholino; ns, not significant. Scale bars: 50 µm.