FIGURE SUMMARY
Title

Mitochondrial calcium uptake orchestrates vertebrate pigmentation via transcriptional regulation of keratin filaments

Authors
Tanwar, J., Ahuja, K., Sharma, A., Sehgal, P., Ranjan, G., Sultan, F., Agrawal, A., D'Angelo, D., Priya, A., Yenamandra, V.K., Singh, A., Raffaello, A., Madesh, M., Rizzuto, R., Sivasubbu, S., Motiani, R.K.
Source
Full text @ PLoS Biol.

Mitochondrial Ca2+ uptake is positively associated with melanogenesis.

(A) Representative B16 cell pellet images of LD day 0, LD day 4, LD day 5, and LD day 6 (N = 3). (B) Melanin content estimation of B16 cells on LD day 0, LD day 4, LD day 5, and LD day 6 (N = 3). (C) Representative mitochondrial Ca2+ imaging traces of CEPIA2mt on LD day 0, LD day 4, LD day 5, and LD day 6 B16 cells stimulated with 100 μm histamine. (D) Quantitation of mitochondrial Ca2+ uptake by calculating ΔCEPIA2mt on LD day 0, LD day 4, LD day 5, and LD day 6 B16 cells stimulated with 100 μm histamine where “n” denotes the number of ROIs. (E) Representative traces of Fura-2 imaging to measure cytosolic Ca2+ on LD day 0, LD day 4, LD day 5, and LD day 6 B16 cells stimulated with 100 μm histamine. (F) Quantitation of cytosolic Ca2+ levels on LD day 0, LD day 4, LD day 5, and LD day 6 B16 cells stimulated with 100 μm histamine where “n” denotes the number of ROIs. (G) Representative western blot showing expression of MCU on LD day 0, LD day 4, LD day 5, and LD day 6. Densitometric analysis using ImageJ is presented below the blot (N = 3). (H) Densitometric quantitation showing MCU levels on LD day 0, LD day 4, LD day 5, and LD day 6 (N = 3). (I) Representative pellet images of LP and DP primary human melanocytes (N = 3). (J) Melanin content estimation of LP and DP primary human melanocytes (N = 3). (K) Representative mitochondrial Ca2+ imaging traces of LP and DP primary human melanocytes stimulated with 100 μm histamine. (L) Quantitation of ΔRhod-2 in LP and DP primary human melanocytes stimulated with 100 μm histamine where “n” denotes the number of ROIs. (M) Representative traces of Fura-2 imaging to measure cytosolic Ca2+ in LP and DP primary human melanocytes stimulated with 100 μm histamine. (N) Quantitation of cytosolic Ca2+ levels in LP and DP primary human melanocytes stimulated with 100 μm histamine where “n” denotes the number of ROIs. (O) Representative western blot showing an increase in MCU protein expression in DP primary human melanocytes in comparison to LP primary human melanocytes. Densitometric analysis using ImageJ is presented below the blot (N = 3). (P) Densitometric quantitation showing increase in MCU protein levels in DP primary human melanocytes in comparison to LP primary human melanocytes (N = 3). Data presented are mean ± SEM. For statistical analysis, unpaired Student’s t test was performed for panels B, J, L, and N, one sample t test was performed for panel P while one-way ANOVA followed by Tukey’s post hoc test was performed for panel D, F, and H using GraphPad Prism software. Here, ns means nonsignificant; * p < 0.05; ** p < 0.01; *** p < 0.001; and **** p < 0.0001. The data underlying for panels B, C, D, E, F, H, J, K, L, M, N, and P shown in the figure can be found in S1 Data. DP, darkly pigmented; LD, low density; LP, lightly pigmented; MCU, mitochondrial calcium uniporter.

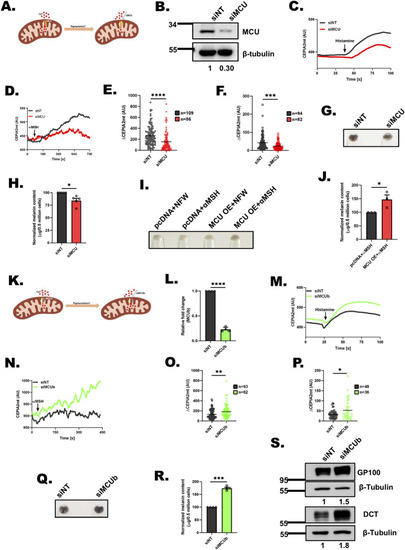
MCU positively regulates melanogenesis while MCUb negatively controls melanogenesis.

(A) Schematic showing effect of MCU silencing on mitochondrial Ca2+ uptake. (B) Representative western blot confirming siRNA based silencing of MCU on LD day 6 B16 cells. Densitometric analysis using ImageJ is presented below the blot (N = 3). (C) Representative mitochondrial Ca2+ imaging traces of CEPIA2mt in siNon-Targeting (siNT) control and siMCU B16 cells stimulated with 100 μm histamine. (D) Representative mitochondrial Ca2+ imaging traces of CEPIA2mt in siNon-Targeting (siNT) control and siMCU B16 cells stimulated with 1 μm αMSH. (E) Quantitation of mitochondrial Ca2+ uptake by calculating increase in CEPIA2mt signal (ΔCEPIA2mt) in siNT control and siMCU B16 cells stimulated with 100 μm histamine where “n” denotes the number of ROIs. (F) Quantitation of mitochondrial Ca2+ uptake by calculating increase in CEPIA2mt signal (ΔCEPIA2mt) in siNT control and siMCU B16 cells stimulated with 1 μm αMSH where “n” denotes the number of ROIs. (G) Representative pellet images of siNT control and siMCU on LD day 6 (N = 5). (H) Melanin content estimation of siNT and siMCU B16 cells on LD day 6 (N = 5). (I) Representative pellet images of pcDNA control plasmid and MCU-GFP overexpression either treated with NFW or αMSH (N = 3). (J) Melanin content estimation of pcDNA control plasmid and MCU-GFP overexpression upon αMSH treatment (N = 3). (K) Schematic showing effect of MCUb silencing on mitochondrial Ca2+ uptake. (L) qRT-PCR analysis showing decrease in MCUb mRNA expression upon MCUb silencing in B16 cells (N = 4). (M) Representative mitochondrial Ca2+ imaging traces of CEPIA2mt in siNT control and siMCUb B16 cells stimulated with 100 μm histamine. (N) Representative mitochondrial Ca2+ imaging traces of CEPIA2mt in siNT control and siMCUb B16 cells stimulated with 1 μm αMSH. (O) Quantitation of mitochondrial Ca2+ uptake by calculating increase in CEPIA2mt signal (ΔCEPIA2mt) in siNT control and siMCUb B16 cells upon stimulation with 100 μm histamine where “n” denotes the number of ROIs. (P) Quantitation of mitochondrial Ca2+ uptake by calculating increase in CEPIA2mt signal (ΔCEPIA2mt) in siNT control and siMCUb B16 cells upon stimulation with 1 μm αMSH where “n” denotes the number of ROIs. (Q) Representative pellet images of siNT control and siMCUb on LD day 6 (N = 4). (R) Melanin content estimation in siNT and siMCUb B16 cells on LD day 6 (N = 4). (S) Representative western blot showing expression of GP100 and DCT on LD day 6 upon MCUb silencing as compared to siNT control. Densitometric analysis using ImageJ is presented below the blot (N = 3). Data presented are mean ± SEM. For statistical analysis, unpaired Student’s t test was performed for panels E, F, J, O, and P, while one sample t test was performed for panels H, L, and R using GraphPad Prism software. Here, * p < 0.05; ** p < 0.01; *** p < 0.001; and **** p < 0.0001. The data underlying for panels C, D, E, F, H, J, L, M, N, O, P, and R shown in the figure can be found in S1 Data. LD, low density; MCU, mitochondrial calcium uniporter; NFW, nuclease free water.

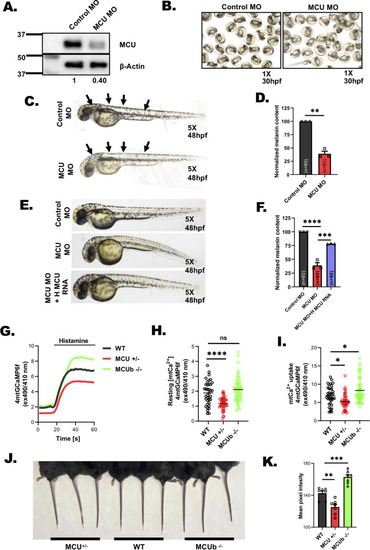
MCU regulates pigmentation in vivo.

(A) Representative western blot showing expression of MCU in control MO and MCU MO. Densitometric analysis using ImageJ is presented below the blot (N = 3). (B) Representative bright-field images of wild-type zebrafish embryos injected with either control morpholino or morpholino targeting zebrafish MCU at 30 hpf (N = 3 independent experiments with approximately 200 embryos/condition). (C) Representative bright-field images of wild-type zebrafish embryos injected with either control morpholino or morpholino targeting zebrafish MCU at 48 hpf (N = 3 independent experiments with approximately 200 embryos/condition). (D) Melanin-content estimation of control MO and MCU MO in zebrafish embryos in around 60 embryos from 3 independent sets of injections (N = 3 independent experiments with 60 embryos/condition). (E) Representative bright-field images of zebrafish embryos injected with control morpholino; morpholino targeting zebrafish MCU and MCU morpholino injected with human MCU RNA (N = 3 independent experiments with approximately 200 embryos/condition). (F) Melanin-content estimation of control MO; MCU MO and MCU MO injected with human MCU RNA in zebrafish embryos in around 60 zebrafish embryos from 3 independent sets of injections (N = 3 independent experiments with 60 embryos/condition). (G) Representative mitochondrial Ca2+ imaging traces of skin fibroblasts isolated from wild-type and MCU+/- and MCUb-/- mice stimulated with 100 μm histamine. (H) Quantitation of resting mitochondrial Ca2+ in skin fibroblasts isolated from wild-type and MCU+/- and MCUb-/- mice. (I) Quantitation of mitochondrial Ca2+ uptake in skin fibroblasts isolated from wild-type and MCU+/- and MCUb-/- mice stimulated with 100 μm histamine. (J) Representative images of tail from 8- to 12-week-old wild-type and MCU+/- and MCUb-/- mice. (K) Quantitation of mean pixel intensity of tail pigmentation measured by ImageJ software in wild-type mice and MCU+/- and MCUb-/- mice (N = 7 data points from 7 independent mice/condition). Data presented are mean ± SEM. For statistical analysis, one sample t test was performed for panel D while one-way ANOVA followed by Tukey’s post hoc test was performed for panel F, H, I, and K using GraphPad Prism software. Here, ** p < 0.01; *** p < 0.001; and **** p < 0.0001. The data underlying for panels D, F, G, H, I, and K shown in the figure can be found in S1 Data. hpf, hours post fertilization; MCU, mitochondrial calcium uniporter.

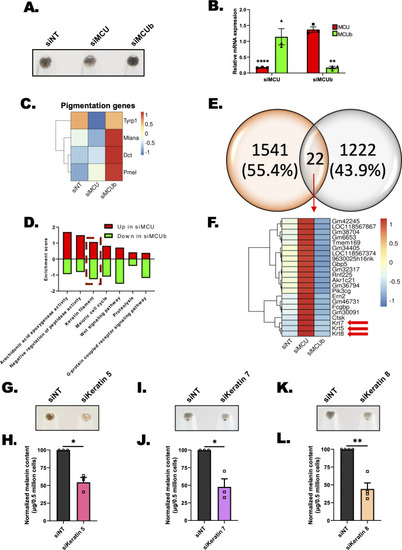
Transcriptomics identifies keratin filaments working downstream of mitochondrial Ca2+ dynamics to regulate melanogenesis.

(A) Representative pellet images of B16 LD cells used for RNA sequencing. (B) qRT-PCR analysis showing decrease in MCU and MCUb mRNA expression upon MCU and MCUb silencing, respectively (N = 3). (C) Heatmap representing the expression of pigmentation genes upon silencing of MCU and MCUb, respectively. Scale from blue to red represents z-score for fold change from −1 to +1. (D) Common oppositely regulated pathways up in siMCU and down in siMCUb. (E) Venn Diagram representing common differentially regulated genes upon silencing of MCU and MCUb. (F) Heatmap representing the expression of 22 common differentially regulated genes upon silencing of MCU and MCUb, respectively. Scale from blue to red represents z-score for fold change from −1 to +1. (G) Representative pellet images of siNT control and siKeratin 5 on LD day 6 (N = 3). (H) Melanin content estimation of siNT and siKeratin 5 B16 cells on LD day 6 (N = 3). (I) Representative pellet images of siNT control and siKeratin 7 on LD day 6 (N = 3). (J) Melanin content estimation of siNT and siKeratin 7 B16 cells on LD day 6 (N = 3). (K) Representative pellet images of siNT control and siKeratin 8 on LD day 6 (N = 4). (L) Melanin content estimation of siNT and siKeratin 8 B16 cells on LD day 6 (N = 4). Data presented are mean ± SEM. For statistical analysis, one sample t test was performed for panels B, H, J, L using GraphPad Prism software. Here, * p < 0.05; ** p < 0.01; and **** p < 0.0001. The data underlying for panels B, C, D, H, J, and L shown in the figure can be found in S1 Data. LD, low density; MCU, mitochondrial calcium uniporter.

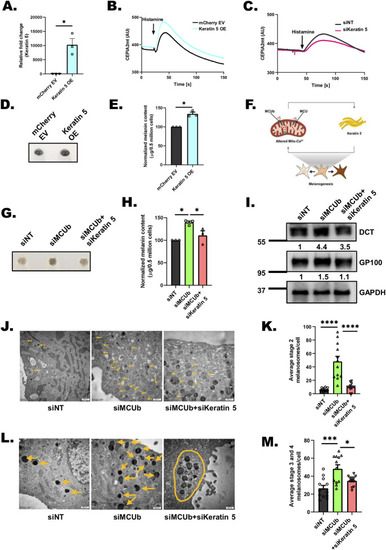
Keratin5 regulates mitochondrial Ca2+ uptake, melanosome maturation, and positioning.

(A) qRT-PCR analysis showing increase in Keratin5 mRNA expression upon ectopic expression of Keratin5 in B16 cells (N = 3). (B) Representative mitochondrial Ca2+ imaging traces of CEPIA2mt in mCherry EV control and Keratin5 overexpressing (OE) cells stimulated with 100 μm histamine. (C) Representative mitochondrial Ca2+ imaging traces of CEPIA2mt in siNT control and siKeratin 5 cells stimulated with 100 μm histamine. (D) Representative pellet images of mCherry EV control and Keratin5 overexpressing (OE) cells on LD day 6 (N = 3). (E) Melanin content estimation of mCherry EV control and Keratin5 overexpressing (OE) cells on LD day 6 (N = 3). (F) Mitochondrial Ca2+ signaling and keratin5 regulate each other in a feedback loop to ensure optimal melanogenesis. (G) Representative pellet images of siNT control, siMCUb, and siMCUb+ siKeratin5 on LD day 6 (N = 3). (H) Melanin content estimation of siNT, siMCUb, and siMCUb+ siKeratin5 on LD day 6 (N = 3). (I) Representative western blot showing expression of DCT and GP100 on LD day 6 upon MCUb, siMCUb+ siKeratin5 silencing as compared to non-targeting control. Densitometric analysis using ImageJ is presented below the blot. (J) TEM images of siNT control, siMCUb, and siMCUb+ siKeratin5 B16 LD day 6 cells. Yellow arrows correspond to stage 2 melanosomes in these cells on LD day 6. (K) Quantification of number of stage 2 melanosomes/cell in siNT control, siMCUb and siMCUb+ siKeratin5 B16 LD day 6 cells (N = 12 cells/condition). (L) TEM images of siNT control, siMCUb, and siMCUb+ siKeratin5 B16 LD day 6 cells. Yellow arrows correspond to melanin rich mature (stages 3 and 4) melanosomes in these cells on LD day 6. Yellow oval shape shows clustering of melanosomes in siMCUb+ siKeratin5. (M) Quantification of number of mature melanosomes/cell in siNT control, siMCUb, and siMCUb+ siKeratin5 B16 LD day 6 (N = 12 cells/condition). Data presented are mean ± SEM. For statistical analysis, one sample t test was performed for panel A, E while one-way ANOVA followed by Tukey’s post hoc test was performed for panels H, K, M using GraphPad Prism software. Here, * p < 0.05; *** p < 0.001; and **** p < 0.0001. The data underlying for panels A, B, C, E, H, K, and M shown in the figure can be found in S1 Data. EV, empty vector; LD, low density; TEM, transmission electron microscope.

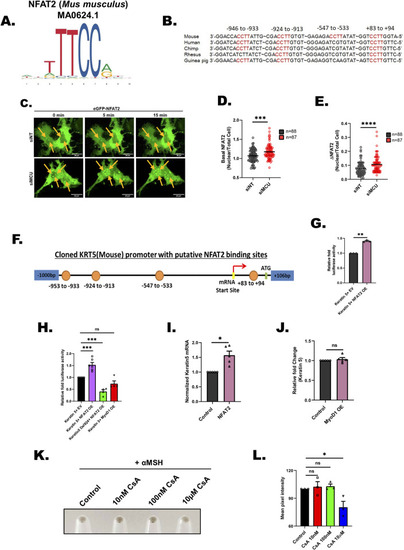
NFAT2 connects MCU to Keratin5 expression.

(A) Position weight matrix of mouse NFAT2 consensus binding sequence. (B) Multispecies sequence alignment of putative NFAT2 binding sites in the mouse keratin5 (KRT5) core promoter. (C) Representative confocal microscopy images of differential NFAT2 nuclear translocation in B16 cells transfected with siNT or siMCU, upon stimulation with 100 μm histamine (5 min and 15 min post stimulation). Images have been captured at 63× (oil) magnification in the GFP channel in a Zeiss confocal microscope. Images presented are maximum intensity projections. (D) Quantification of basal NFAT2 nuclear levels in B16 cells with MCU knockdown. Live cell imaging was performed in B16 cells transfected with siMCU or control siRNA along with eGFP-NFAT2 overexpression. Nuclear/Cytoplasmic ratio of NFAT2 was quantified by determining the GFP fluorescence from the nucleus versus total area of a single cell; “n” represents the total number of cells imaged per condition. (E) Quantification of NFAT2 nuclear translocation upon histamine stimulation. Live cell imaging was performed in B16 cells transfected with siMCU or control siNT along with eGFP-NFAT2 overexpression. Nuclear/Cytoplasmic ratio of NFAT2 was quantified by determining the GFP fluorescence from the nucleus versus total area of a single cell. NFAT2 nuclear translocation in response to histamine (100 μm) stimulation was quantified by calculating the difference between maximal NFAT2 nuclear/total ratio upon histamine stimulation and basal NFAT2 nuclear/total ratio of unstimulated cells; “n” represents the total number of cells imaged per condition. (F) Schematic representation of putative NFAT2 binding sites in the mouse KRT5 core promoter cloned in pGL4.23 luciferase vector. (G) Normalized luciferase activity of the KRT5 promoter luciferase reporter vector with overexpression of eGFP-NFAT2 or empty vector control in B16 cells (N = 3). (H) Normalized luciferase activity of the KRT5 promoter luciferase reporter vector with overexpression of eGFP-NFAT2 or empty vector control or MyoD1 transcription factor and KRT5 Del924 promoter luciferase reporter vector with overexpression of eGFP-NFAT2 (N = 4–6). (I) Normalized mRNA expression of mouse KRT5 gene in B16 cells with overexpression of eGFP-NFAT2 or empty vector control (N = 6). (J) Normalized mRNA expression of mouse KRT5 gene in B16 cells with overexpression of MyoD1 or empty vector control (N = 5). (K) Representative pellet images upon cyclosporine A treatment in B16 cells as compared to vehicle control. (L) Mean pixel intensity of cyclosporine A treatment in B16 cells as compared to vehicle control (N = 3). Data presented are mean ± SEM. For statistical analysis, one sample t test was performed for panels G, I, and J, Mann–Whitney test was performed for panels D, E while one-way ANOVA followed by Dunnette’s multiple comparisons test was performed for panels H and L using GraphPad Prism software. Here, * p < 0.05; ** p < 0.01; *** p < 0.001; and **** p < 0.0001. The data underlying for panels D, E, G, H, I, J, and L shown in the figure can be found in S1 Data. MCU, mitochondrial calcium uniporter.

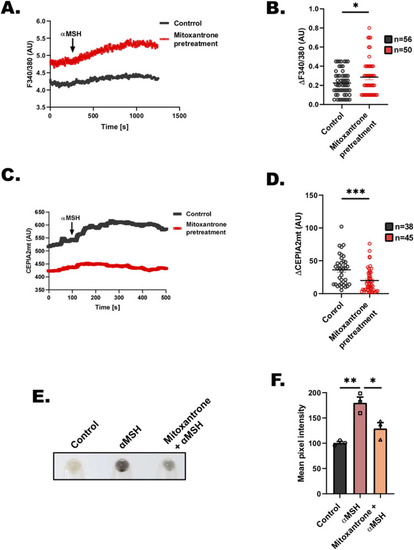
Mitoxantrone inhibits αMSH-induced physiological pigmentation.

(A) Representative traces of Fura-2 imaging to measure cytosolic Ca2+ in control and mitoxantrone pretreated B16 cells stimulated with 1 μm αMSH. (B) Quantitation of cytosolic Ca2+ levels in control and mitoxantrone pretreated B16 cells stimulated with 1 μm αMSH where “n” denotes the number of ROIs. (C) Representative mitochondrial Ca2+ imaging traces of CEPIA2mt in control and mitoxantrone pretreated B16 cells stimulated with 1 μm αMSH. (D) Quantitation of mitochondrial Ca2+ uptake by calculating increase in CEPIA2mt signal (ΔCEPIA2mt) in control and mitoxantrone pretreated B16 cells stimulated with 100 μm histamine where “n” denotes the number of ROIs. (E) Representative pellet pictures upon αMSH, αMSH+mitoxantrone treatment in B16 cells as compared to vehicle control. (F) Mean pixel intensity of αMSH, αMSH+mitoxantrone treatment in B16 cells as compared to vehicle control (N = 3). Data presented are mean ± SEM. For statistical analysis, unpaired Student’s t test was performed for panels B and D, while one-way ANOVA followed by Tukey’s post hoc test was performed for panel F using GraphPad Prism software. Here, * p < 0.05; ** p < 0.01; *** p < 0.001; and **** p < 0.0001. The data underlying for panels A, B, C, D, and F shown in the figure can be found in S1 Data.

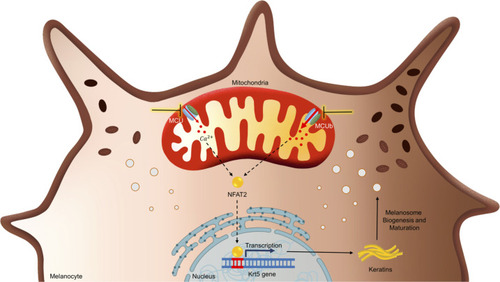
MCU complex mediated mitochondrial Ca2+ dynamics regulates pigmentation via NFAT2-Keratin5 signaling module.

Graphical summary of the work illustrating that silencing of MCU decreases melanogenesis while MCUb knockdown enhances melanogenesis. Transcription factor NFAT2 gets activated upon MCU silencing and that in turn induces keratin5 expression. Keratin5 drives melanogenesis by augmenting melanosome biogenesis and maturation. MCU, mitochondrial calcium uniporter.

Acknowledgments
This image is the copyrighted work of the attributed author or publisher, and ZFIN has permission only to display this image to its users. Additional permissions should be obtained from the applicable author or publisher of the image. Full text @ PLoS Biol.