IMAGE

Fig 5

ID
ZDB-IMAGE-241122-6
Source
Figures for Tanwar et al., 2024
Image
Figure Caption

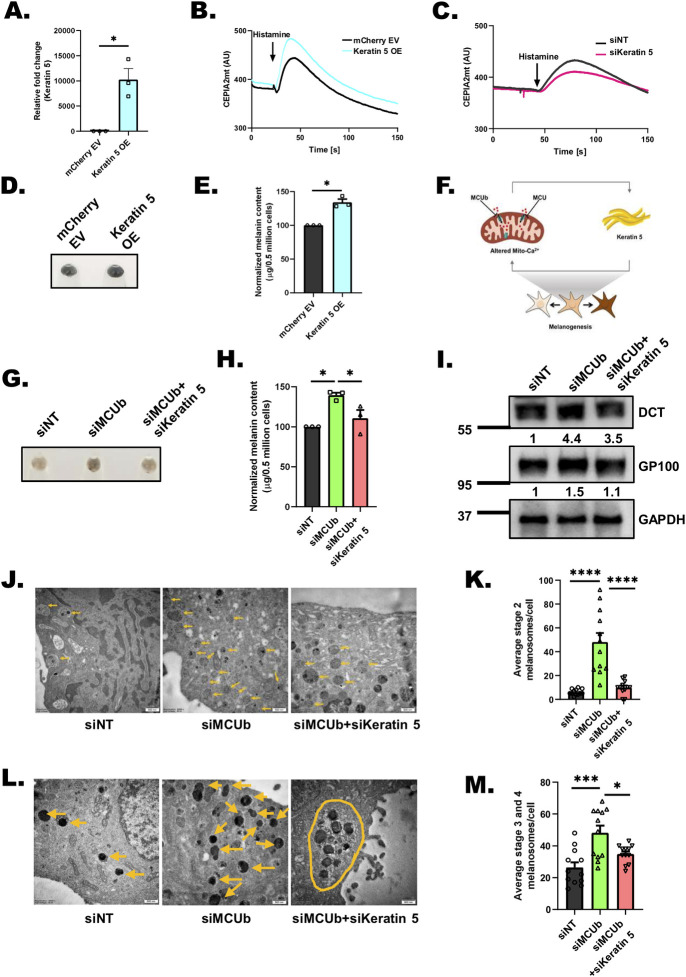
Fig 5 Keratin5 regulates mitochondrial Ca2+ uptake, melanosome maturation, and positioning.

(A) qRT-PCR analysis showing increase in Keratin5 mRNA expression upon ectopic expression of Keratin5 in B16 cells (N = 3). (B) Representative mitochondrial Ca2+ imaging traces of CEPIA2mt in mCherry EV control and Keratin5 overexpressing (OE) cells stimulated with 100 μm histamine. (C) Representative mitochondrial Ca2+ imaging traces of CEPIA2mt in siNT control and siKeratin 5 cells stimulated with 100 μm histamine. (D) Representative pellet images of mCherry EV control and Keratin5 overexpressing (OE) cells on LD day 6 (N = 3). (E) Melanin content estimation of mCherry EV control and Keratin5 overexpressing (OE) cells on LD day 6 (N = 3). (F) Mitochondrial Ca2+ signaling and keratin5 regulate each other in a feedback loop to ensure optimal melanogenesis. (G) Representative pellet images of siNT control, siMCUb, and siMCUb+ siKeratin5 on LD day 6 (N = 3). (H) Melanin content estimation of siNT, siMCUb, and siMCUb+ siKeratin5 on LD day 6 (N = 3). (I) Representative western blot showing expression of DCT and GP100 on LD day 6 upon MCUb, siMCUb+ siKeratin5 silencing as compared to non-targeting control. Densitometric analysis using ImageJ is presented below the blot. (J) TEM images of siNT control, siMCUb, and siMCUb+ siKeratin5 B16 LD day 6 cells. Yellow arrows correspond to stage 2 melanosomes in these cells on LD day 6. (K) Quantification of number of stage 2 melanosomes/cell in siNT control, siMCUb and siMCUb+ siKeratin5 B16 LD day 6 cells (N = 12 cells/condition). (L) TEM images of siNT control, siMCUb, and siMCUb+ siKeratin5 B16 LD day 6 cells. Yellow arrows correspond to melanin rich mature (stages 3 and 4) melanosomes in these cells on LD day 6. Yellow oval shape shows clustering of melanosomes in siMCUb+ siKeratin5. (M) Quantification of number of mature melanosomes/cell in siNT control, siMCUb, and siMCUb+ siKeratin5 B16 LD day 6 (N = 12 cells/condition). Data presented are mean ± SEM. For statistical analysis, one sample t test was performed for panel A, E while one-way ANOVA followed by Tukey’s post hoc test was performed for panels H, K, M using GraphPad Prism software. Here, * p < 0.05; *** p < 0.001; and **** p < 0.0001. The data underlying for panels A, B, C, E, H, K, and M shown in the figure can be found in S1 Data. EV, empty vector; LD, low density; TEM, transmission electron microscope.

Acknowledgments
This image is the copyrighted work of the attributed author or publisher, and ZFIN has permission only to display this image to its users. Additional permissions should be obtained from the applicable author or publisher of the image. Full text @ PLoS Biol.