IMAGE

Fig 7

ID
ZDB-IMAGE-241122-8
Source
Figures for Tanwar et al., 2024
Image
Figure Caption

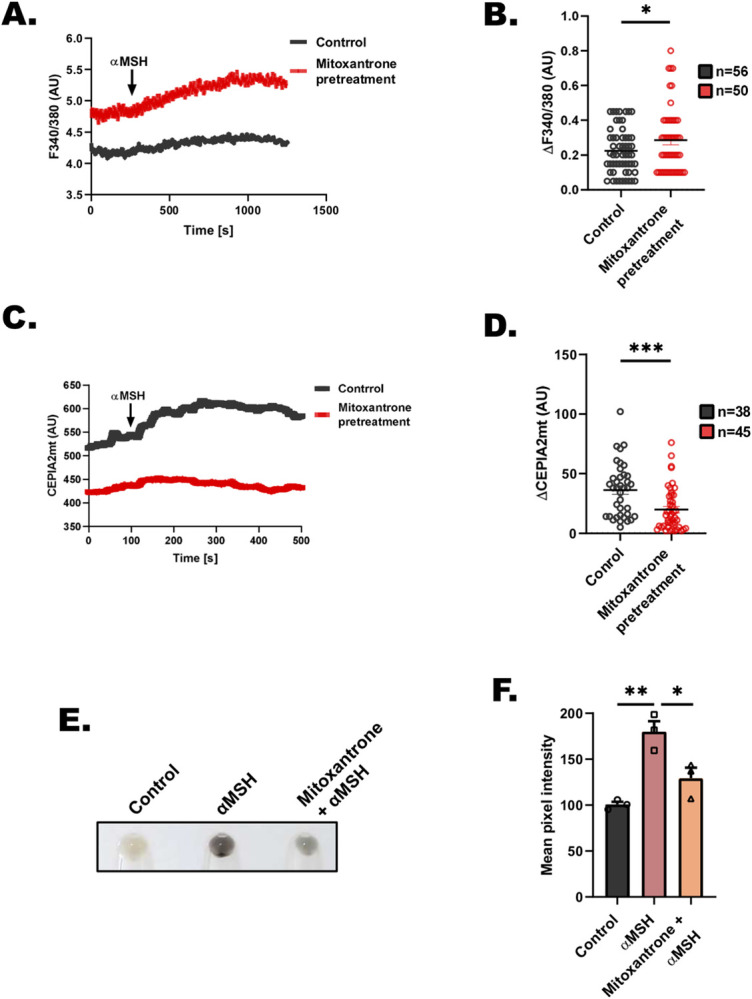
Fig 7 Mitoxantrone inhibits αMSH-induced physiological pigmentation.

(A) Representative traces of Fura-2 imaging to measure cytosolic Ca2+ in control and mitoxantrone pretreated B16 cells stimulated with 1 μm αMSH. (B) Quantitation of cytosolic Ca2+ levels in control and mitoxantrone pretreated B16 cells stimulated with 1 μm αMSH where “n” denotes the number of ROIs. (C) Representative mitochondrial Ca2+ imaging traces of CEPIA2mt in control and mitoxantrone pretreated B16 cells stimulated with 1 μm αMSH. (D) Quantitation of mitochondrial Ca2+ uptake by calculating increase in CEPIA2mt signal (ΔCEPIA2mt) in control and mitoxantrone pretreated B16 cells stimulated with 100 μm histamine where “n” denotes the number of ROIs. (E) Representative pellet pictures upon αMSH, αMSH+mitoxantrone treatment in B16 cells as compared to vehicle control. (F) Mean pixel intensity of αMSH, αMSH+mitoxantrone treatment in B16 cells as compared to vehicle control (N = 3). Data presented are mean ± SEM. For statistical analysis, unpaired Student’s t test was performed for panels B and D, while one-way ANOVA followed by Tukey’s post hoc test was performed for panel F using GraphPad Prism software. Here, * p < 0.05; ** p < 0.01; *** p < 0.001; and **** p < 0.0001. The data underlying for panels A, B, C, D, and F shown in the figure can be found in S1 Data.

Acknowledgments
This image is the copyrighted work of the attributed author or publisher, and ZFIN has permission only to display this image to its users. Additional permissions should be obtained from the applicable author or publisher of the image. Full text @ PLoS Biol.