|
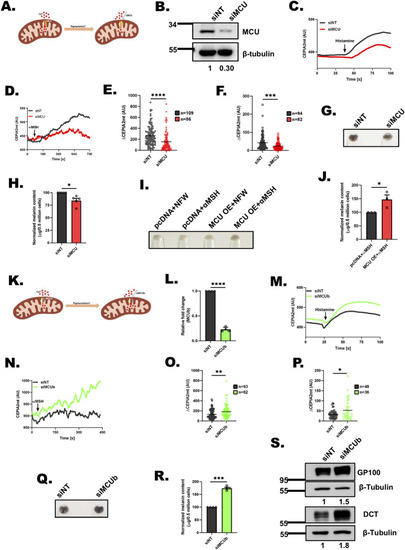
MCU positively regulates melanogenesis while MCUb negatively controls melanogenesis. (A) Schematic showing effect of MCU silencing on mitochondrial Ca2+ uptake. (B) Representative western blot confirming siRNA based silencing of MCU on LD day 6 B16 cells. Densitometric analysis using ImageJ is presented below the blot (N = 3). (C) Representative mitochondrial Ca2+ imaging traces of CEPIA2mt in siNon-Targeting (siNT) control and siMCU B16 cells stimulated with 100 μm histamine. (D) Representative mitochondrial Ca2+ imaging traces of CEPIA2mt in siNon-Targeting (siNT) control and siMCU B16 cells stimulated with 1 μm αMSH. (E) Quantitation of mitochondrial Ca2+ uptake by calculating increase in CEPIA2mt signal (ΔCEPIA2mt) in siNT control and siMCU B16 cells stimulated with 100 μm histamine where “n” denotes the number of ROIs. (F) Quantitation of mitochondrial Ca2+ uptake by calculating increase in CEPIA2mt signal (ΔCEPIA2mt) in siNT control and siMCU B16 cells stimulated with 1 μm αMSH where “n” denotes the number of ROIs. (G) Representative pellet images of siNT control and siMCU on LD day 6 (N = 5). (H) Melanin content estimation of siNT and siMCU B16 cells on LD day 6 (N = 5). (I) Representative pellet images of pcDNA control plasmid and MCU-GFP overexpression either treated with NFW or αMSH (N = 3). (J) Melanin content estimation of pcDNA control plasmid and MCU-GFP overexpression upon αMSH treatment (N = 3). (K) Schematic showing effect of MCUb silencing on mitochondrial Ca2+ uptake. (L) qRT-PCR analysis showing decrease in MCUb mRNA expression upon MCUb silencing in B16 cells (N = 4). (M) Representative mitochondrial Ca2+ imaging traces of CEPIA2mt in siNT control and siMCUb B16 cells stimulated with 100 μm histamine. (N) Representative mitochondrial Ca2+ imaging traces of CEPIA2mt in siNT control and siMCUb B16 cells stimulated with 1 μm αMSH. (O) Quantitation of mitochondrial Ca2+ uptake by calculating increase in CEPIA2mt signal (ΔCEPIA2mt) in siNT control and siMCUb B16 cells upon stimulation with 100 μm histamine where “n” denotes the number of ROIs. (P) Quantitation of mitochondrial Ca2+ uptake by calculating increase in CEPIA2mt signal (ΔCEPIA2mt) in siNT control and siMCUb B16 cells upon stimulation with 1 μm αMSH where “n” denotes the number of ROIs. (Q) Representative pellet images of siNT control and siMCUb on LD day 6 (N = 4). (R) Melanin content estimation in siNT and siMCUb B16 cells on LD day 6 (N = 4). (S) Representative western blot showing expression of GP100 and DCT on LD day 6 upon MCUb silencing as compared to siNT control. Densitometric analysis using ImageJ is presented below the blot (N = 3). Data presented are mean ± SEM. For statistical analysis, unpaired Student’s t test was performed for panels E, F, J, O, and P, while one sample t test was performed for panels H, L, and R using GraphPad Prism software. Here, * p < 0.05; ** p < 0.01; *** p < 0.001; and **** p < 0.0001. The data underlying for panels C, D, E, F, H, J, L, M, N, O, P, and R shown in the figure can be found in S1 Data. LD, low density; MCU, mitochondrial calcium uniporter; NFW, nuclease free water.
|