IMAGE

Fig 6

ID
ZDB-IMAGE-241122-7
Source
Figures for Tanwar et al., 2024
Image
Figure Caption

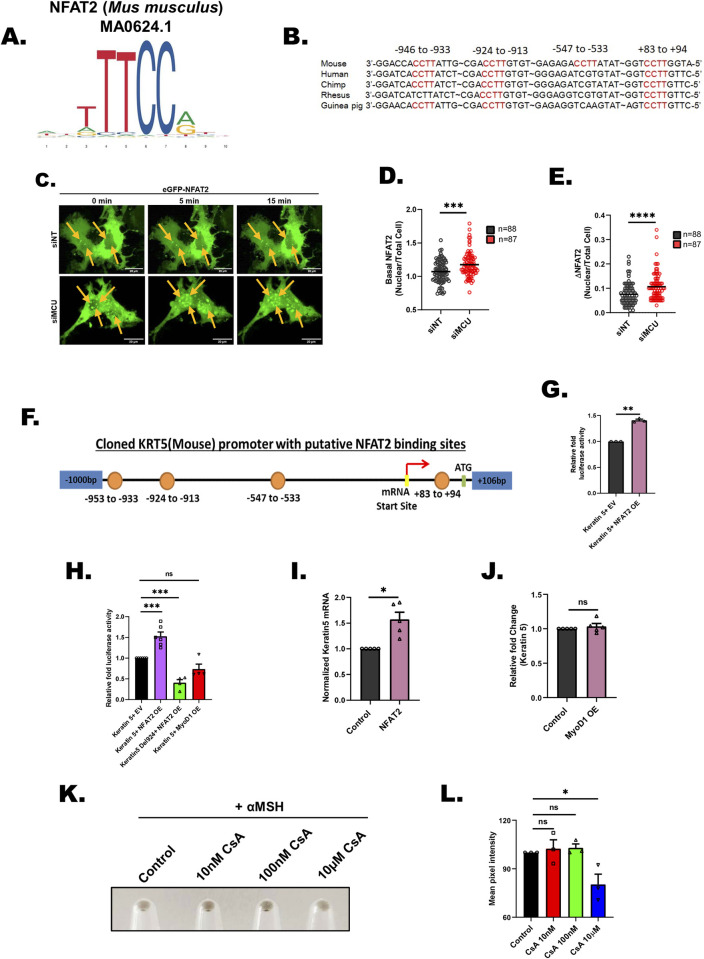
Fig 6 NFAT2 connects MCU to Keratin5 expression.

(A) Position weight matrix of mouse NFAT2 consensus binding sequence. (B) Multispecies sequence alignment of putative NFAT2 binding sites in the mouse keratin5 (KRT5) core promoter. (C) Representative confocal microscopy images of differential NFAT2 nuclear translocation in B16 cells transfected with siNT or siMCU, upon stimulation with 100 μm histamine (5 min and 15 min post stimulation). Images have been captured at 63× (oil) magnification in the GFP channel in a Zeiss confocal microscope. Images presented are maximum intensity projections. (D) Quantification of basal NFAT2 nuclear levels in B16 cells with MCU knockdown. Live cell imaging was performed in B16 cells transfected with siMCU or control siRNA along with eGFP-NFAT2 overexpression. Nuclear/Cytoplasmic ratio of NFAT2 was quantified by determining the GFP fluorescence from the nucleus versus total area of a single cell; “n” represents the total number of cells imaged per condition. (E) Quantification of NFAT2 nuclear translocation upon histamine stimulation. Live cell imaging was performed in B16 cells transfected with siMCU or control siNT along with eGFP-NFAT2 overexpression. Nuclear/Cytoplasmic ratio of NFAT2 was quantified by determining the GFP fluorescence from the nucleus versus total area of a single cell. NFAT2 nuclear translocation in response to histamine (100 μm) stimulation was quantified by calculating the difference between maximal NFAT2 nuclear/total ratio upon histamine stimulation and basal NFAT2 nuclear/total ratio of unstimulated cells; “n” represents the total number of cells imaged per condition. (F) Schematic representation of putative NFAT2 binding sites in the mouse KRT5 core promoter cloned in pGL4.23 luciferase vector. (G) Normalized luciferase activity of the KRT5 promoter luciferase reporter vector with overexpression of eGFP-NFAT2 or empty vector control in B16 cells (N = 3). (H) Normalized luciferase activity of the KRT5 promoter luciferase reporter vector with overexpression of eGFP-NFAT2 or empty vector control or MyoD1 transcription factor and KRT5 Del924 promoter luciferase reporter vector with overexpression of eGFP-NFAT2 (N = 4–6). (I) Normalized mRNA expression of mouse KRT5 gene in B16 cells with overexpression of eGFP-NFAT2 or empty vector control (N = 6). (J) Normalized mRNA expression of mouse KRT5 gene in B16 cells with overexpression of MyoD1 or empty vector control (N = 5). (K) Representative pellet images upon cyclosporine A treatment in B16 cells as compared to vehicle control. (L) Mean pixel intensity of cyclosporine A treatment in B16 cells as compared to vehicle control (N = 3). Data presented are mean ± SEM. For statistical analysis, one sample t test was performed for panels G, I, and J, Mann–Whitney test was performed for panels D, E while one-way ANOVA followed by Dunnette’s multiple comparisons test was performed for panels H and L using GraphPad Prism software. Here, * p < 0.05; ** p < 0.01; *** p < 0.001; and **** p < 0.0001. The data underlying for panels D, E, G, H, I, J, and L shown in the figure can be found in S1 Data. MCU, mitochondrial calcium uniporter.

Acknowledgments
This image is the copyrighted work of the attributed author or publisher, and ZFIN has permission only to display this image to its users. Additional permissions should be obtained from the applicable author or publisher of the image. Full text @ PLoS Biol.