|
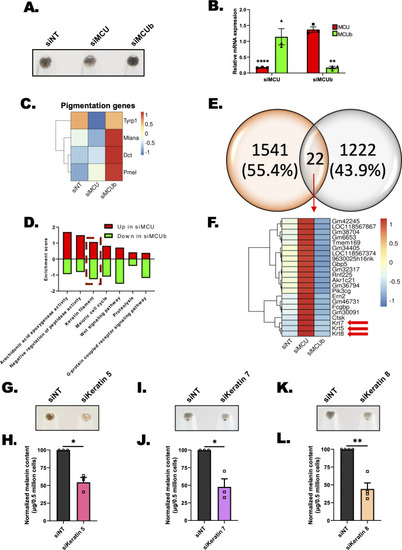
Transcriptomics identifies keratin filaments working downstream of mitochondrial Ca2+ dynamics to regulate melanogenesis. (A) Representative pellet images of B16 LD cells used for RNA sequencing. (B) qRT-PCR analysis showing decrease in MCU and MCUb mRNA expression upon MCU and MCUb silencing, respectively (N = 3). (C) Heatmap representing the expression of pigmentation genes upon silencing of MCU and MCUb, respectively. Scale from blue to red represents z-score for fold change from −1 to +1. (D) Common oppositely regulated pathways up in siMCU and down in siMCUb. (E) Venn Diagram representing common differentially regulated genes upon silencing of MCU and MCUb. (F) Heatmap representing the expression of 22 common differentially regulated genes upon silencing of MCU and MCUb, respectively. Scale from blue to red represents z-score for fold change from −1 to +1. (G) Representative pellet images of siNT control and siKeratin 5 on LD day 6 (N = 3). (H) Melanin content estimation of siNT and siKeratin 5 B16 cells on LD day 6 (N = 3). (I) Representative pellet images of siNT control and siKeratin 7 on LD day 6 (N = 3). (J) Melanin content estimation of siNT and siKeratin 7 B16 cells on LD day 6 (N = 3). (K) Representative pellet images of siNT control and siKeratin 8 on LD day 6 (N = 4). (L) Melanin content estimation of siNT and siKeratin 8 B16 cells on LD day 6 (N = 4). Data presented are mean ± SEM. For statistical analysis, one sample t test was performed for panels B, H, J, L using GraphPad Prism software. Here, * p < 0.05; ** p < 0.01; and **** p < 0.0001. The data underlying for panels B, C, D, H, J, and L shown in the figure can be found in S1 Data. LD, low density; MCU, mitochondrial calcium uniporter.
|