|
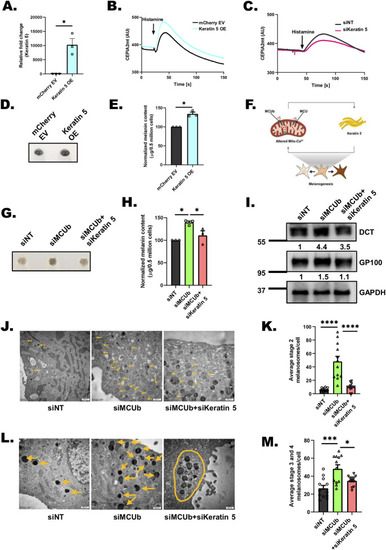
Keratin5 regulates mitochondrial Ca2+ uptake, melanosome maturation, and positioning. (A) qRT-PCR analysis showing increase in Keratin5 mRNA expression upon ectopic expression of Keratin5 in B16 cells (N = 3). (B) Representative mitochondrial Ca2+ imaging traces of CEPIA2mt in mCherry EV control and Keratin5 overexpressing (OE) cells stimulated with 100 μm histamine. (C) Representative mitochondrial Ca2+ imaging traces of CEPIA2mt in siNT control and siKeratin 5 cells stimulated with 100 μm histamine. (D) Representative pellet images of mCherry EV control and Keratin5 overexpressing (OE) cells on LD day 6 (N = 3). (E) Melanin content estimation of mCherry EV control and Keratin5 overexpressing (OE) cells on LD day 6 (N = 3). (F) Mitochondrial Ca2+ signaling and keratin5 regulate each other in a feedback loop to ensure optimal melanogenesis. (G) Representative pellet images of siNT control, siMCUb, and siMCUb+ siKeratin5 on LD day 6 (N = 3). (H) Melanin content estimation of siNT, siMCUb, and siMCUb+ siKeratin5 on LD day 6 (N = 3). (I) Representative western blot showing expression of DCT and GP100 on LD day 6 upon MCUb, siMCUb+ siKeratin5 silencing as compared to non-targeting control. Densitometric analysis using ImageJ is presented below the blot. (J) TEM images of siNT control, siMCUb, and siMCUb+ siKeratin5 B16 LD day 6 cells. Yellow arrows correspond to stage 2 melanosomes in these cells on LD day 6. (K) Quantification of number of stage 2 melanosomes/cell in siNT control, siMCUb and siMCUb+ siKeratin5 B16 LD day 6 cells (N = 12 cells/condition). (L) TEM images of siNT control, siMCUb, and siMCUb+ siKeratin5 B16 LD day 6 cells. Yellow arrows correspond to melanin rich mature (stages 3 and 4) melanosomes in these cells on LD day 6. Yellow oval shape shows clustering of melanosomes in siMCUb+ siKeratin5. (M) Quantification of number of mature melanosomes/cell in siNT control, siMCUb, and siMCUb+ siKeratin5 B16 LD day 6 (N = 12 cells/condition). Data presented are mean ± SEM. For statistical analysis, one sample t test was performed for panel A, E while one-way ANOVA followed by Tukey’s post hoc test was performed for panels H, K, M using GraphPad Prism software. Here, * p < 0.05; *** p < 0.001; and **** p < 0.0001. The data underlying for panels A, B, C, E, H, K, and M shown in the figure can be found in S1 Data. EV, empty vector; LD, low density; TEM, transmission electron microscope.
|