|
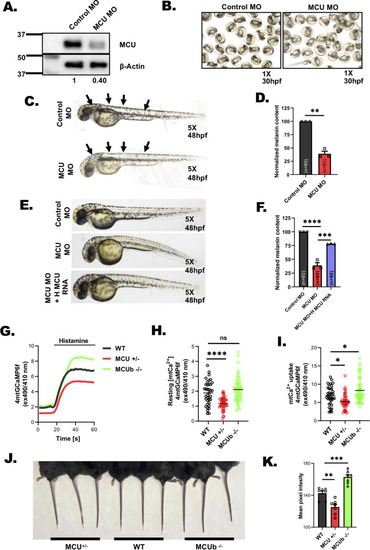
MCU regulates pigmentation in vivo. (A) Representative western blot showing expression of MCU in control MO and MCU MO. Densitometric analysis using ImageJ is presented below the blot (N = 3). (B) Representative bright-field images of wild-type zebrafish embryos injected with either control morpholino or morpholino targeting zebrafish MCU at 30 hpf (N = 3 independent experiments with approximately 200 embryos/condition). (C) Representative bright-field images of wild-type zebrafish embryos injected with either control morpholino or morpholino targeting zebrafish MCU at 48 hpf (N = 3 independent experiments with approximately 200 embryos/condition). (D) Melanin-content estimation of control MO and MCU MO in zebrafish embryos in around 60 embryos from 3 independent sets of injections (N = 3 independent experiments with 60 embryos/condition). (E) Representative bright-field images of zebrafish embryos injected with control morpholino; morpholino targeting zebrafish MCU and MCU morpholino injected with human MCU RNA (N = 3 independent experiments with approximately 200 embryos/condition). (F) Melanin-content estimation of control MO; MCU MO and MCU MO injected with human MCU RNA in zebrafish embryos in around 60 zebrafish embryos from 3 independent sets of injections (N = 3 independent experiments with 60 embryos/condition). (G) Representative mitochondrial Ca2+ imaging traces of skin fibroblasts isolated from wild-type and MCU+/- and MCUb-/- mice stimulated with 100 μm histamine. (H) Quantitation of resting mitochondrial Ca2+ in skin fibroblasts isolated from wild-type and MCU+/- and MCUb-/- mice. (I) Quantitation of mitochondrial Ca2+ uptake in skin fibroblasts isolated from wild-type and MCU+/- and MCUb-/- mice stimulated with 100 μm histamine. (J) Representative images of tail from 8- to 12-week-old wild-type and MCU+/- and MCUb-/- mice. (K) Quantitation of mean pixel intensity of tail pigmentation measured by ImageJ software in wild-type mice and MCU+/- and MCUb-/- mice (N = 7 data points from 7 independent mice/condition). Data presented are mean ± SEM. For statistical analysis, one sample t test was performed for panel D while one-way ANOVA followed by Tukey’s post hoc test was performed for panel F, H, I, and K using GraphPad Prism software. Here, ** p < 0.01; *** p < 0.001; and **** p < 0.0001. The data underlying for panels D, F, G, H, I, and K shown in the figure can be found in S1 Data. hpf, hours post fertilization; MCU, mitochondrial calcium uniporter.
|