IMAGE

Fig 3

ID
ZDB-IMAGE-241122-4
Source
Figures for Tanwar et al., 2024
Image
Figure Caption

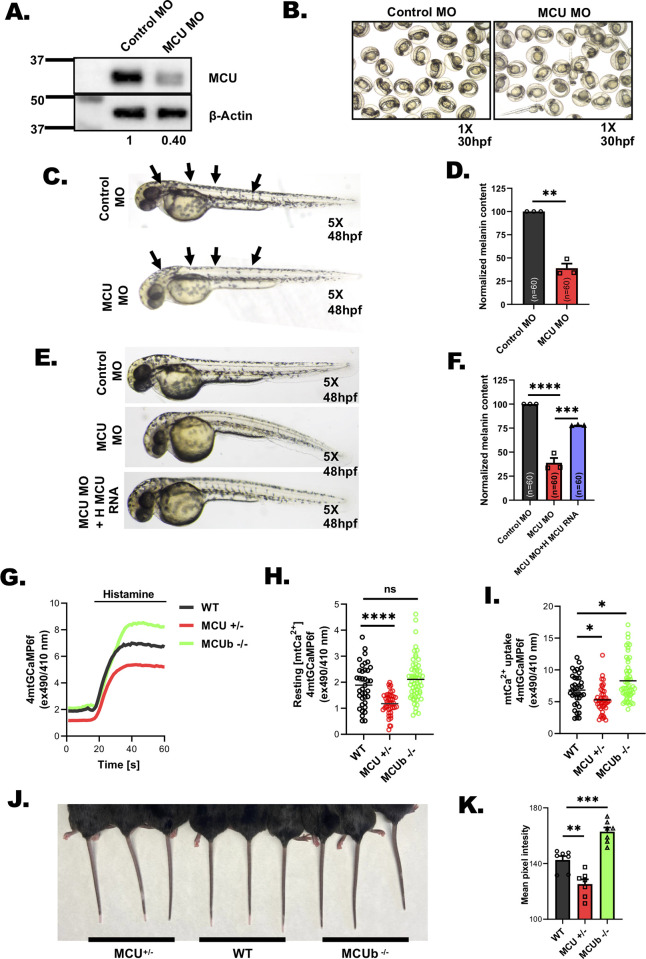
Fig 3 MCU regulates pigmentation in vivo.

(A) Representative western blot showing expression of MCU in control MO and MCU MO. Densitometric analysis using ImageJ is presented below the blot (N = 3). (B) Representative bright-field images of wild-type zebrafish embryos injected with either control morpholino or morpholino targeting zebrafish MCU at 30 hpf (N = 3 independent experiments with approximately 200 embryos/condition). (C) Representative bright-field images of wild-type zebrafish embryos injected with either control morpholino or morpholino targeting zebrafish MCU at 48 hpf (N = 3 independent experiments with approximately 200 embryos/condition). (D) Melanin-content estimation of control MO and MCU MO in zebrafish embryos in around 60 embryos from 3 independent sets of injections (N = 3 independent experiments with 60 embryos/condition). (E) Representative bright-field images of zebrafish embryos injected with control morpholino; morpholino targeting zebrafish MCU and MCU morpholino injected with human MCU RNA (N = 3 independent experiments with approximately 200 embryos/condition). (F) Melanin-content estimation of control MO; MCU MO and MCU MO injected with human MCU RNA in zebrafish embryos in around 60 zebrafish embryos from 3 independent sets of injections (N = 3 independent experiments with 60 embryos/condition). (G) Representative mitochondrial Ca2+ imaging traces of skin fibroblasts isolated from wild-type and MCU+/- and MCUb-/- mice stimulated with 100 μm histamine. (H) Quantitation of resting mitochondrial Ca2+ in skin fibroblasts isolated from wild-type and MCU+/- and MCUb-/- mice. (I) Quantitation of mitochondrial Ca2+ uptake in skin fibroblasts isolated from wild-type and MCU+/- and MCUb-/- mice stimulated with 100 μm histamine. (J) Representative images of tail from 8- to 12-week-old wild-type and MCU+/- and MCUb-/- mice. (K) Quantitation of mean pixel intensity of tail pigmentation measured by ImageJ software in wild-type mice and MCU+/- and MCUb-/- mice (N = 7 data points from 7 independent mice/condition). Data presented are mean ± SEM. For statistical analysis, one sample t test was performed for panel D while one-way ANOVA followed by Tukey’s post hoc test was performed for panel F, H, I, and K using GraphPad Prism software. Here, ** p < 0.01; *** p < 0.001; and **** p < 0.0001. The data underlying for panels D, F, G, H, I, and K shown in the figure can be found in S1 Data. hpf, hours post fertilization; MCU, mitochondrial calcium uniporter.

Acknowledgments
This image is the copyrighted work of the attributed author or publisher, and ZFIN has permission only to display this image to its users. Additional permissions should be obtained from the applicable author or publisher of the image. Full text @ PLoS Biol.