Figure Caption
Fig 1
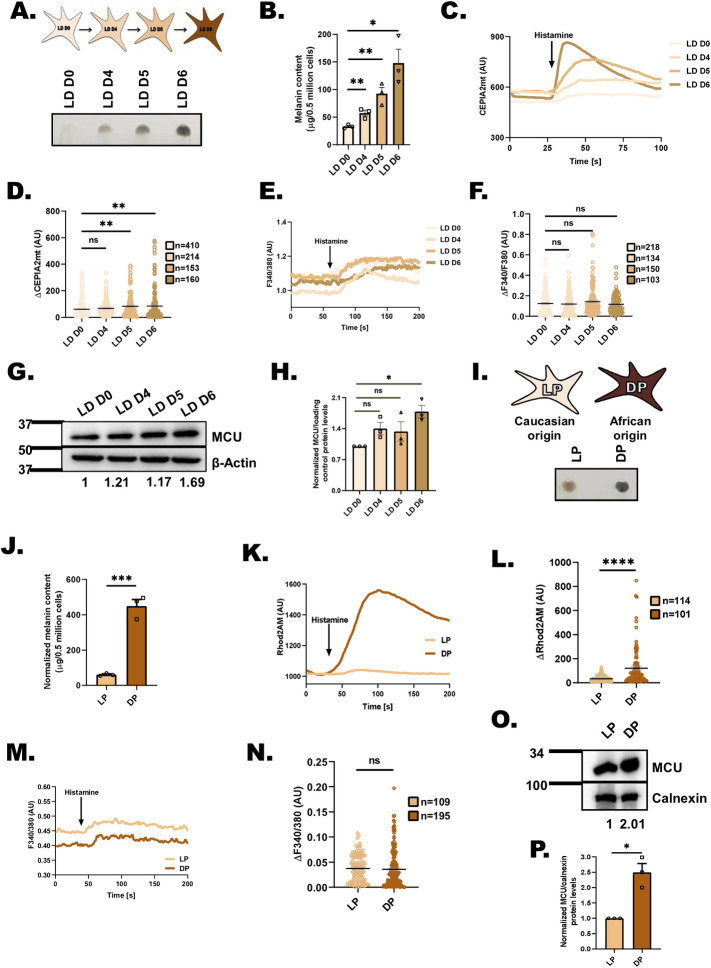
Mitochondrial Ca2+ uptake is positively associated with melanogenesis.
(A) Representative B16 cell pellet images of LD day 0, LD day 4, LD day 5, and LD day 6 (N = 3). (B) Melanin content estimation of B16 cells on LD day 0, LD day 4, LD day 5, and LD day 6 (N = 3). (C) Representative mitochondrial Ca2+ imaging traces of CEPIA2mt on LD day 0, LD day 4, LD day 5, and LD day 6 B16 cells stimulated with 100 μm histamine. (D) Quantitation of mitochondrial Ca2+ uptake by calculating ΔCEPIA2mt on LD day 0, LD day 4, LD day 5, and LD day 6 B16 cells stimulated with 100 μm histamine where “n” denotes the number of ROIs. (E) Representative traces of Fura-2 imaging to measure cytosolic Ca2+ on LD day 0, LD day 4, LD day 5, and LD day 6 B16 cells stimulated with 100 μm histamine. (F) Quantitation of cytosolic Ca2+ levels on LD day 0, LD day 4, LD day 5, and LD day 6 B16 cells stimulated with 100 μm histamine where “n” denotes the number of ROIs. (G) Representative western blot showing expression of MCU on LD day 0, LD day 4, LD day 5, and LD day 6. Densitometric analysis using ImageJ is presented below the blot (N = 3). (H) Densitometric quantitation showing MCU levels on LD day 0, LD day 4, LD day 5, and LD day 6 (N = 3). (I) Representative pellet images of LP and DP primary human melanocytes (N = 3). (J) Melanin content estimation of LP and DP primary human melanocytes (N = 3). (K) Representative mitochondrial Ca2+ imaging traces of LP and DP primary human melanocytes stimulated with 100 μm histamine. (L) Quantitation of ΔRhod-2 in LP and DP primary human melanocytes stimulated with 100 μm histamine where “n” denotes the number of ROIs. (M) Representative traces of Fura-2 imaging to measure cytosolic Ca2+ in LP and DP primary human melanocytes stimulated with 100 μm histamine. (N) Quantitation of cytosolic Ca2+ levels in LP and DP primary human melanocytes stimulated with 100 μm histamine where “n” denotes the number of ROIs. (O) Representative western blot showing an increase in MCU protein expression in DP primary human melanocytes in comparison to LP primary human melanocytes. Densitometric analysis using ImageJ is presented below the blot (N = 3). (P) Densitometric quantitation showing increase in MCU protein levels in DP primary human melanocytes in comparison to LP primary human melanocytes (N = 3). Data presented are mean ± SEM. For statistical analysis, unpaired Student’s t test was performed for panels B, J, L, and N, one sample t test was performed for panel P while one-way ANOVA followed by Tukey’s post hoc test was performed for panel D, F, and H using GraphPad Prism software. Here, ns means nonsignificant; * p < 0.05; ** p < 0.01; *** p < 0.001; and **** p < 0.0001. The data underlying for panels B, C, D, E, F, H, J, K, L, M, N, and P shown in the figure can be found in S1 Data. DP, darkly pigmented; LD, low density; LP, lightly pigmented; MCU, mitochondrial calcium uniporter.
Acknowledgments
This image is the copyrighted work of the attributed author or publisher, and
ZFIN has permission only to display this image to its users.
Additional permissions should be obtained from the applicable author or publisher of the image.
Full text @ PLoS Biol.