
- Title
-
Gα13 controls pharyngeal endoderm convergence by regulating E-cadherin expression and RhoA activation
- Authors
- Hu, B., Pinzour, J., Patel, A., Rooney, F., Zerwic, A., Gao, Y., Nguyen, N.T., Xie, H., Ye, D., Lin, F.
- Source
- Full text @ Development

Phenotypes of gna13a−/−/gna13b−/−embryos resemble those observed in gna13a/gna13b MO-injected embryos. (A-F′) Bright-field images showing different phenotypic classes of cardiac edema and tail blister in gna13a/gna13b-deficient embryos at 49 hpf: normal morphology (A), mild cardiac edema only (B), severe cardiac edema only (C), tail blister only (D), mild cardiac edema and tail blister (E), and severe cardiac edema and tail blister (F). Lateral views. (A′-F′) Zoomed-in images showing the tail region (outlined in A) of embryos in A-F. Blue arrowheads, cardiac edema; red arrowheads, tail blister. (G) The percentage of phenotypic classes from embryos of the indicated genotypes. (H-J) Epifluorescence images of the pharyngeal endoderm in Tg(sox17:EGFP) control (H) and gna13a−/− embryos injected with gna13b MO (I,J) at the 24-somite stage. White lines (equivalent length in embryos) indicate the width of the anterior endodermal sheet; white asterisk indicates the endodermal hole (observed in 46.5% of gna13a−/−/gna13b MO embryos). (K) Average endoderm width in the indicated groups. Data are mean±s.e.m. ****P<0.0001 (unpaired, two-tailed Student's t-test). |
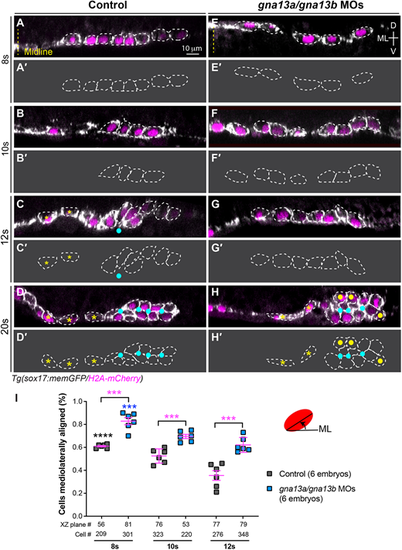
Gα13 regulates pharyngeal endoderm organization during endoderm C&E. (A-H) XZ images of confocal z-stacks taken in the anterior region of the pharyngeal endoderm in control (A-D) and gna13a/gna13b MOs-injected (E-H) embryos at the indicated stages. Some cells are outlined with white dashed lines. (A'-H′) Outlines of some of the endodermal cells in A-H. Yellow dashed line, midline; yellow asterisks, single layer endodermal cells; cyan dots, apical centers; yellow dots, cells that failed to meet at the rosette center. ML, mediolateral; D, dorsal; V, ventral. (I) Percentage of cells in which the longitudinal axis was oriented ±20° relative to the ML embryonic axis in embryos in A-H. Data are mean±s.e.m. ***P<0.001 (magenta; unpaired, two-tailed Student's t-test between control and gna13a/gna13b MOs-injected embryos). ****P<0.0001 (black; one-way ANOVA analyses for control embryos at different stages); ***P<0.001 (blue; one-way ANOVA analyses for gna13a/gna13b MOs-injected embryos at different stages). |
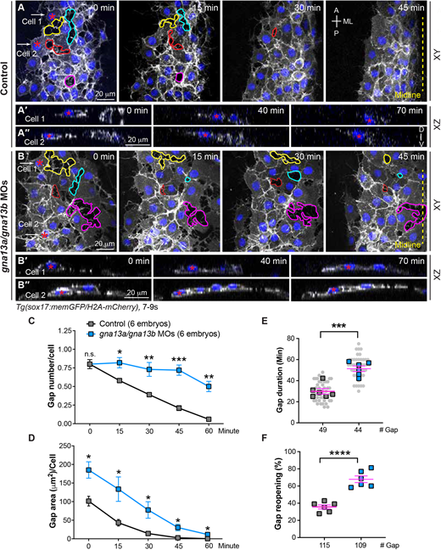
Gα13 regulates stable cell-cell contacts and proper changes of endodermal cell shape during endoderm C&E. Confocal time-lapse experiments were conducted at the most lateral and anterior regions of pharyngeal endoderm in the indicated embryos during 7-9 ss. (A,B) Snapshots of confocal z projections in the xy view, taken at different time points from Movie 1, illustrating the morphology of endodermal cells at various time points. Gaps between endodermal cells are outlined, and the same gap over time is outlined by the same color. (A'-B″) Confocal images of xz planes of two representative cells (cell 1 and cell 2), captured at regions marked by white arrows in A and B, from Movie 2, illustrating the orientation of the nuclei of two cells at the indicated time-points. (C-F) The average number (C), area (D), duration (E) and reopening frequency (F) of the gaps in endodermal cells in the indicated embryos at different time points. (E) Data from all embryos (squares) and all xy images (gray circles) are superimposed. A, anterior; P, posterior; ML, mediolateral; D, dorsal; V, ventral. Yellow dashed line, midline. Data are mean±s.e.m. n.s. (not significant), P>0.05; *P<0.05; **P<0.01; ***P<0.001; ****P<0.0001 (unpaired, two-tailed Student's t-test). |
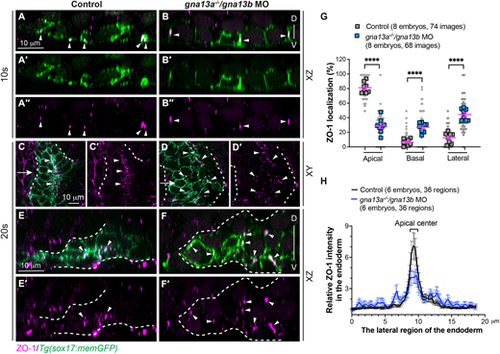
Gα13 is required for efficient apical constriction of endodermal cells. Whole-mount immunostaining was conducted to determine ZO-1 localization. (A-F′) Confocal images showing ZO-1 localization (magenta, white arrowheads) in pharyngeal endodermal cells (green, labelled by memGFP) in the indicated embryos at 10 ss (A-B″) and 20 ss (C-F′). (A-B″) Confocal images of xz planes at 10 ss. (C-D′) Single confocal z-plane in xy view. (E-F′) Confocal mages of xz planes, captured at the positions marked by the white arrows in C,D. White dashed lines outline the endoderm. D, dorsal; V, ventral. (G) The frequencies of ZO-1 localization in the apical, basal and lateral region of endodermal cells in xz planes at 10 ss. Data from all embryos (squares) and all xz images (gray circles) are superimposed, with the number of xz images and embryos indicated. Data are mean±s.e.m. ****P<0.0001 (unpaired, two-tailed Student's t-test). (H) Average relative intensity of ZO-1 expression across the lateral region of the endoderm in xy planes at 20 ss. The number of regions of images and embryos analyzed is indicated. Data are mean±s.e.m. |
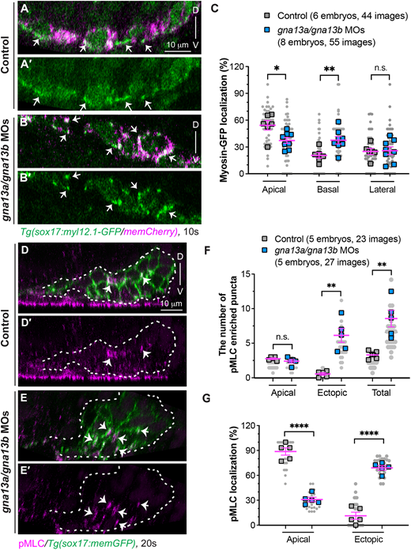
Gα13 controls spatial actomyosin activity to regulate endoderm convergence. (A-C) Myosin dynamics in the indicated embryos at 10 ss. (A-B′) Confocal images of xz planes showing the localization of Myl12.1-GFP in mem-mCherry-labelled endodermal cells (magenta). Arrows indicate enriched Myl12.1-GFP labeled puncta. (C) The frequencies of Myl12.1-GFP labeling in the apical, basal and lateral region of endodermal cells in xz planes. (D-G) Expression of pMLC, detected by whole-mount immunostaining, in the indicated embryos at 20 ss. (D-E′) Confocal images of xz planes showing the localization of pMLC (magenta) in memGFP-labelled endodermal cells. Arrows indicate pMLC-labeled puncta. White dashed lines outline the endoderm. (F,G) Distribution of pMLC expression. (F) The average number of pMLC-labeled puncta in the apical and ectopic regions, as well as the total number. (G) The frequencies of pMLC-labelled puncta in the apical and ectopic regions in the indicated embryos. Data from all embryos (squares) and all XZ images (gray circles) are superimposed, with the number of xz images and embryos indicated. Data are mean±s.e.m. n.s. (not significant), P>0.05; *P<0.05; **P<0.01; ****P<0.0001 (unpaired, two-tailed Student's t-test). D, dorsal; V, ventral. |
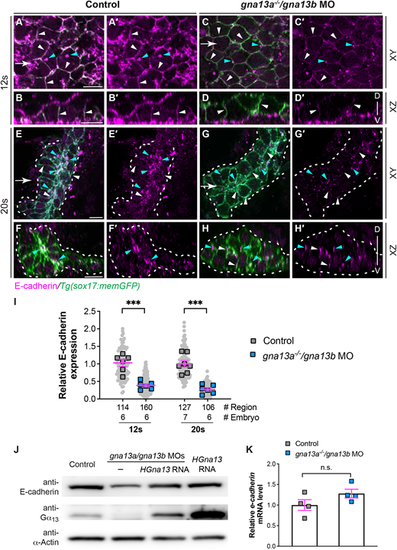
E-cadherin abundance is reduced in gna13a/gna13b-deficient embryos. (A-H′) Whole-mount immunostaining of E-cadherin localization (magenta) in the indicated embryos. (A,A′,C,C′,E,E′,G,G′) Single confocal z plane in the xy view. (B,B′,D,D′,F,F′,H,H′) Confocal images of xz planes, captured at regions marked by white arrows in A,C,E,G. White arrowheads indicate E-cadherin localization on the plasma membrane of endoderm cells. Cyan arrowheads indicate E-cadherin-enriched puncta in the cytosol of endodermal cells. Dashed lines indicate the endoderm boundary. D, dorsal; V, ventral. (I) Relative intensity of E-cadherin signal on the plasma membrane of endodermal cells at 12 ss in A and C, and in the regions in the endodermal rosettes at 20 ss in E and G in the indicated embryos. Data from all embryos (squares) and regions (gray circles) are superimposed, with the number of regions and embryos indicated. (J) Western blot of E-cadherin and α-actin (loading control) in the indicated embryos at 9 ss. (K) qPCR of cdh1 mRNA in the indicated embryos at 9 ss. Four experiments were performed. Data are mean±s.e.m. n.s. (not significant), P>0.05; ***P<0.001 (unpaired, two-tailed Student's t-test). Scale bars: 10 µm. |
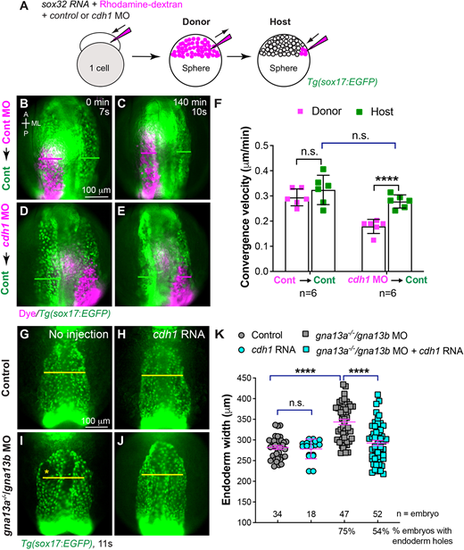
E-cadherin is responsible for endodermal C&E defects in gna13a/gna13b-deficient embryos. (A) Schematic diagram illustrating endoderm transplantation procedure. Donor embryos were injected with sox32 RNA (which confers endodermal identity to all cells), rhodamine-dextran (a lineage tracer) and a control p53 MO or MOs targeting cdh1 and p53 at the one-cell stage. At the sphere stage, about 50 donor cells were transplanted into host Tg(sox17:EGFP) embryos (endoderm is labeled with EGFP). (B-E) Snapshots from Movie 3 showing the pharyngeal EGFP-labelled endoderm in control Tg(sox17:EGFP) hosts transplanted with rhodamine-labeled donor cells (magenta) at the beginning (0 min, 7s) and end (140 min, 10s) of the movie. (B,C) Control MO-injected cells. (D,E) cdh1 MO-injected cells. Magenta and green lines indicate the widths of the donor and host endodermal sheets, respectively. Dorsoanterior view with anterior upwards. A, anterior; P, posterior; ML, mediolateral. (F) Average convergence velocity of donor and host endoderm in indicated embryos in B-E with the number of embryos indicated. Data were generated from four experiments. (G-J) Epifluorescence images of the pharyngeal endoderm in fixed Tg(sox17:EGFP) embryos at 11 ss that were uninjected or injected with cdh1 RNA. Yellow asterisks indicate endodermal holes. Yellow lines (equivalent length) indicate the width of the pharyngeal endoderm sheet. Dorsoanterior view with anterior upwards. (K) Average width of the pharyngeal endoderm in the indicated embryos shown in G-J, from three experiments. The number of embryos analyzed in each group is indicated. Data are mean±s.e.m. n.s. (not significant), P>0.05; ****P<0.0001 (unpaired, two-tailed Student's t-test). |
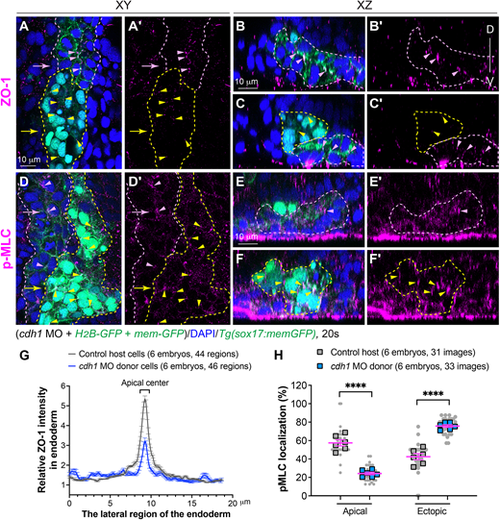
E-cadherin is crucial for myosin activation and apical polarity of endodermal cells. Cells from donor embryos co-injected with RNAs encoding sox32, H2B-GFP, mem-GFP and cdh1 MOs were transplanted into control host Tg(sox17:memGFP) embryos in which endoderm is labeled with memGFP. (A-F′) Whole-mount immunostaining to detect localization of pMLC and ZO-1 in host embryos at 20 ss. (A,A′,D,D′) Confocal images of a single z-plane in xy view. (B-C′,E-F′) Images of xz planes captured at the positions marked by arrows in A an D. Pink dashed lines indicate host wild-type endoderm cells; yellow dashed lines indicate donor cdh1-deficient endoderm cells (nuclei labeled with EGFP). Localization of p-MLC- and ZO-1-expressing puncta in control endoderm cells (pink arrowheads), and in transplanted cdh1-deficient endoderm cells (yellow arrowheads). D, dorsal; V, ventral. (G) Average relative intensity of ZO-1 distribution by plot analysis across the lateral region of the endoderm in xy planes in donor and host endodermal cell populations. The number of images of xz planes and embryos is indicated. Data are mean±s.e.m. (H) The frequencies of pMLC-labelled puncta in the apical and ectopic regions in the indicated embryos. Data from all embryos (squares) and all xz images (gray circles) are superimposed, with the number of xz images and embryos indicated. Data are mean±s.e.m. ****P<0.0001 (unpaired, two-tailed Student's t-test). |
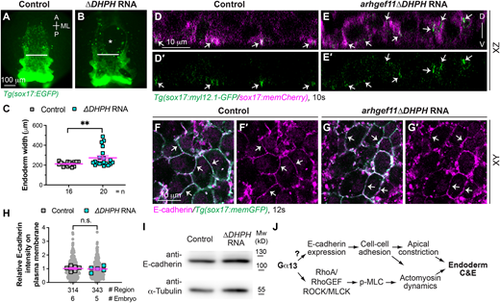
Interference with RhoGEF disrupts spatial actomyosin activation but does not impact E-cadherin expression. (A-C) Overexpressing dominant-negative RhoGEF disrupts endoderm C&E. (A,B) Epifluorescence images of pharyngeal endoderm in the indicated embryos. White lines (equivalent length in embryos) indicate the width of the anterior endodermal sheet; white asterisk indicates an endodermal hole. (C) Average endoderm width of the pharyngeal endoderm in the indicated embryos shown in A,B, with the number of embryos indicated. (D-E′) Confocal images of xz planes showing localization of Myl12.1-GFP in mem-mCherry-labelled endodermal cells (magenta) in the indicated embryos at 10 ss. White arrows indicate enriched Myl12.1-GFP labelling. (F-I) Overexpressing dominant-negative RhoGEF does not affect E-cadherin expression. (F-G′) Confocal images of a single xy plane showing E-cadherin localization (magenta, detected by whole mount immunostaining) in the indicated embryos at 12 ss. White arrows, indicate E-cadherin localization on the plasma membrane of endoderm cells. (H) Relative intensity of E-cadherin expression on the plasma membrane of endoderm cells in the indicated embryos in F,G. Data from all embryos (squares) and regions (gray circles) are superimposed, with the number of embryos and regions indicated. (I) Western blot of the expression of E-cadherin and α-tubulin (loading control) in the indicated embryos at 12 ss. (J) Model illustrating the mechanisms through which Gα13 controls endoderm C&E: by regulating both E-cadherin expression and RhoA activation. Data are mean±s.e.m. n.s. (not significant), P>0.05; **P<0.01 (unpaired, two-tailed Student's t-test). |