
Fig. 6
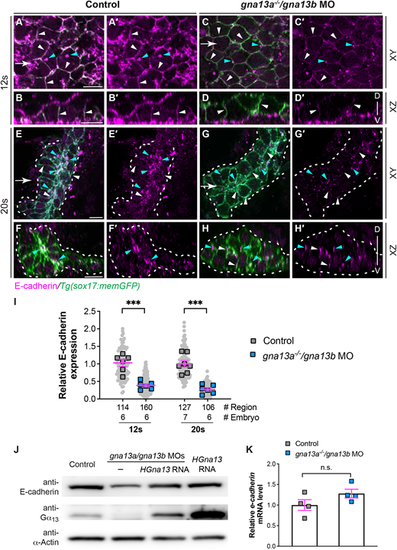
E-cadherin abundance is reduced in gna13a/gna13b-deficient embryos. (A-H′) Whole-mount immunostaining of E-cadherin localization (magenta) in the indicated embryos. (A,A′,C,C′,E,E′,G,G′) Single confocal z plane in the xy view. (B,B′,D,D′,F,F′,H,H′) Confocal images of xz planes, captured at regions marked by white arrows in A,C,E,G. White arrowheads indicate E-cadherin localization on the plasma membrane of endoderm cells. Cyan arrowheads indicate E-cadherin-enriched puncta in the cytosol of endodermal cells. Dashed lines indicate the endoderm boundary. D, dorsal; V, ventral. (I) Relative intensity of E-cadherin signal on the plasma membrane of endodermal cells at 12 ss in A and C, and in the regions in the endodermal rosettes at 20 ss in E and G in the indicated embryos. Data from all embryos (squares) and regions (gray circles) are superimposed, with the number of regions and embryos indicated. (J) Western blot of E-cadherin and α-actin (loading control) in the indicated embryos at 9 ss. (K) qPCR of cdh1 mRNA in the indicated embryos at 9 ss. Four experiments were performed. Data are mean±s.e.m. n.s. (not significant), P>0.05; ***P<0.001 (unpaired, two-tailed Student's t-test). Scale bars: 10 µm. |