
Fig. 2
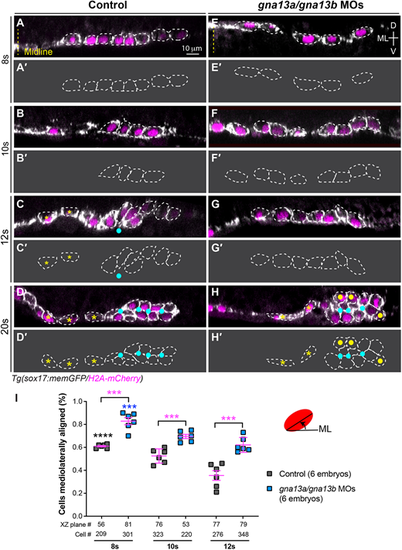
Gα13 regulates pharyngeal endoderm organization during endoderm C&E. (A-H) XZ images of confocal z-stacks taken in the anterior region of the pharyngeal endoderm in control (A-D) and gna13a/gna13b MOs-injected (E-H) embryos at the indicated stages. Some cells are outlined with white dashed lines. (A'-H′) Outlines of some of the endodermal cells in A-H. Yellow dashed line, midline; yellow asterisks, single layer endodermal cells; cyan dots, apical centers; yellow dots, cells that failed to meet at the rosette center. ML, mediolateral; D, dorsal; V, ventral. (I) Percentage of cells in which the longitudinal axis was oriented ±20° relative to the ML embryonic axis in embryos in A-H. Data are mean±s.e.m. ***P<0.001 (magenta; unpaired, two-tailed Student's t-test between control and gna13a/gna13b MOs-injected embryos). ****P<0.0001 (black; one-way ANOVA analyses for control embryos at different stages); ***P<0.001 (blue; one-way ANOVA analyses for gna13a/gna13b MOs-injected embryos at different stages). |