
Fig. 9
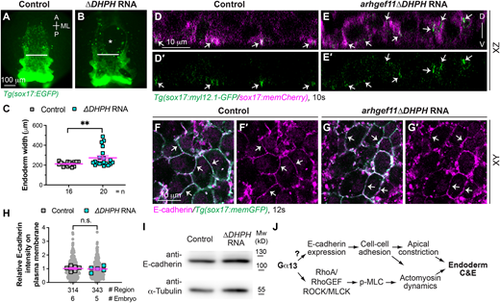
Interference with RhoGEF disrupts spatial actomyosin activation but does not impact E-cadherin expression. (A-C) Overexpressing dominant-negative RhoGEF disrupts endoderm C&E. (A,B) Epifluorescence images of pharyngeal endoderm in the indicated embryos. White lines (equivalent length in embryos) indicate the width of the anterior endodermal sheet; white asterisk indicates an endodermal hole. (C) Average endoderm width of the pharyngeal endoderm in the indicated embryos shown in A,B, with the number of embryos indicated. (D-E′) Confocal images of xz planes showing localization of Myl12.1-GFP in mem-mCherry-labelled endodermal cells (magenta) in the indicated embryos at 10 ss. White arrows indicate enriched Myl12.1-GFP labelling. (F-I) Overexpressing dominant-negative RhoGEF does not affect E-cadherin expression. (F-G′) Confocal images of a single xy plane showing E-cadherin localization (magenta, detected by whole mount immunostaining) in the indicated embryos at 12 ss. White arrows, indicate E-cadherin localization on the plasma membrane of endoderm cells. (H) Relative intensity of E-cadherin expression on the plasma membrane of endoderm cells in the indicated embryos in F,G. Data from all embryos (squares) and regions (gray circles) are superimposed, with the number of embryos and regions indicated. (I) Western blot of the expression of E-cadherin and α-tubulin (loading control) in the indicated embryos at 12 ss. (J) Model illustrating the mechanisms through which Gα13 controls endoderm C&E: by regulating both E-cadherin expression and RhoA activation. Data are mean±s.e.m. n.s. (not significant), P>0.05; **P<0.01 (unpaired, two-tailed Student's t-test). |