
Fig. 8
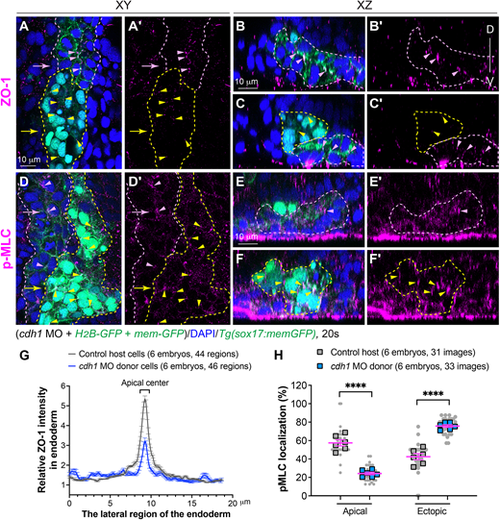
E-cadherin is crucial for myosin activation and apical polarity of endodermal cells. Cells from donor embryos co-injected with RNAs encoding sox32, H2B-GFP, mem-GFP and cdh1 MOs were transplanted into control host Tg(sox17:memGFP) embryos in which endoderm is labeled with memGFP. (A-F′) Whole-mount immunostaining to detect localization of pMLC and ZO-1 in host embryos at 20 ss. (A,A′,D,D′) Confocal images of a single z-plane in xy view. (B-C′,E-F′) Images of xz planes captured at the positions marked by arrows in A an D. Pink dashed lines indicate host wild-type endoderm cells; yellow dashed lines indicate donor cdh1-deficient endoderm cells (nuclei labeled with EGFP). Localization of p-MLC- and ZO-1-expressing puncta in control endoderm cells (pink arrowheads), and in transplanted cdh1-deficient endoderm cells (yellow arrowheads). D, dorsal; V, ventral. (G) Average relative intensity of ZO-1 distribution by plot analysis across the lateral region of the endoderm in xy planes in donor and host endodermal cell populations. The number of images of xz planes and embryos is indicated. Data are mean±s.e.m. (H) The frequencies of pMLC-labelled puncta in the apical and ectopic regions in the indicated embryos. Data from all embryos (squares) and all xz images (gray circles) are superimposed, with the number of xz images and embryos indicated. Data are mean±s.e.m. ****P<0.0001 (unpaired, two-tailed Student's t-test). |