
- Title
-
Novel mathematical approach to accurately quantify 3D endothelial cell morphology and vessel geometry based on fluorescently marked endothelial cell contours: Application to the dorsal aorta of wild-type and Endoglin-deficient zebrafish embryos
- Authors
- Seeler, D., Grdseloff, N., Rödel, C.J., Kloft, C., Abdelilah-Seyfried, S., Huisinga, W.
- Source
- Full text @ PLoS Comput. Biol.
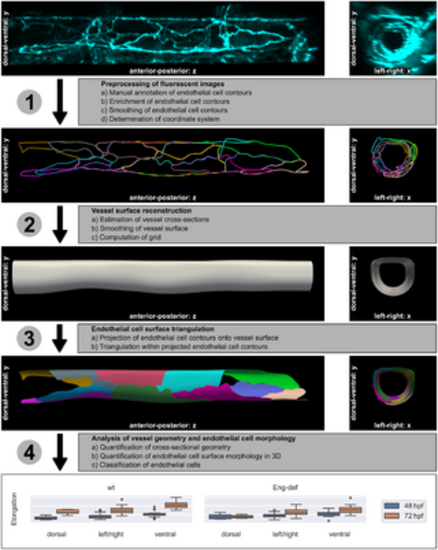
Method overview. The individual steps are explained in the text. The 3D microscopy image in the top row stems from Endoglin-deficient embryo 13 at 72 hpf and was used for the subsequent computations in the rows below. Elongation of ECs was quantified using the analysis data (see Table 1). |
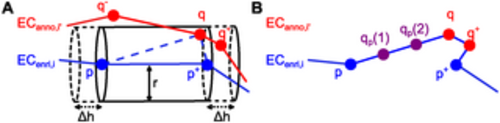
Cell contour enrichment. (A) Enrichment by neighboring cells. ECenri,i is the current version of the enriched cell contour of cell i. ECanno,i′ is the manually annotated cell contour of cell i′. In the previous iteration, it was checked whether point q− ∈ ECanno,i′ lies in any cylinder centered around an edge of ECenri,i. As q− was too far away from these edges, it was not inserted into ECenri,i. In the current iteration, it is found that q ∈ ECanno,i′ lies in the cylinder centered around the edge (p, p+) of ECenri,i with radius r and length h = ||p+ − p||2 + 2Δh. Thus, q is inserted into ECenri,i. Following insertion of q, point q+ will be inserted into ECenri,i in the subsequent iteration because it will be located within the cylinder centered around (q, p+). (B) Enrichment by interpolation. The enriched cell contour ECenri,i resulting from adding both q and q+ is shown. Two points qp(1) and qp(2) obtained by linear interpolation are added on the edge (p, q). |
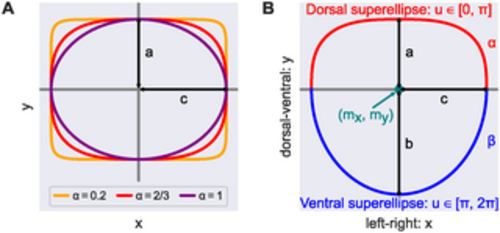
Cross-sectional shape model. (A) All points on the superellipses satisfy |x/c|2/α + |y/a|2/α = 1. For α = 1 the superellipse reduces to an ellipse. The smaller the value of α < 1, the closer the superellipse shape is to a rectangle. (B) We modeled DA cross-sections by joining two (half) superellipses. Here, (mx, my) is the shape’s midpoint and a, b, c are the shape’s semi-axis lengths; α, β specify the extent of flattening of each superellipse. |
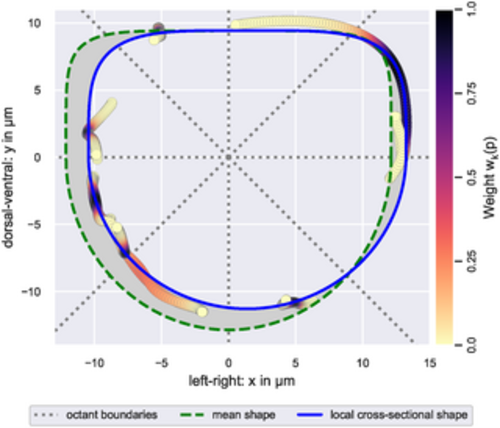
Estimation of a local cross-sectional shape. Visualized is the local cross-sectional shape estimated from points (circles) on EC contour splines that were projected onto the cross-sectional (xy-)plane. Data points are colored according to their weight during the estimation, i.e., their distance along the z-axis from the local cross-sectional plane (see color bar). Note that data points with a weight of zero are omitted in the figure. The employed weight function ensured that the estimation was based on at least noct data points with non-zero weight per plane octant. Initial parameter values for the local cross-sectional shape were provided by the mean shape. During estimation, the deviation of the local cross-sectional shape from the mean shape, i.e., the area of the gray region relative to the area within the green dashed curve, was bound from above by λ. The illustrated cross-sectional shape was estimated using noct = 30 and λ = 20%. |
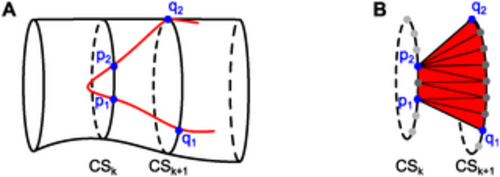
Triangulation within a projected cell contour. (A) In red, part of the projected cell contour on the smoothed vessel cross-sections is shown. To triangulate the part of the cell surface between cross-sections k and (k + 1), the edges (p1, q1) and (p2, q2) of the projected cell contour between these two cross-sections are identified. (B) A triangulation connects the cross-sectional path between p1 and p2 and the cross-sectional path between q1 and q2 within the cell surface. This triangulation is performed for each pair of neighboring vessel cross-sections that contains parts of the cell surface. |
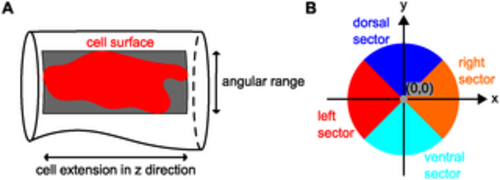
Details on characteristics used during morphological analysis. (A) The bounding box of a cell surface spans the entire angular range covered by the cell on the vessel surface along its length in z-direction. (B) Cross-sectional sectors for classification of cell location. |
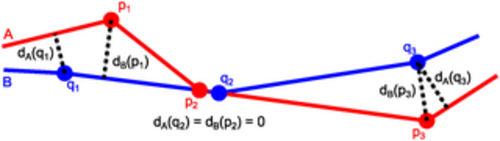
Point distances to contours. Distances (dotted lines) of points p1, p2 and p3 on contour A and points q1, q2 and q3 on contour B to the other contour (see also Eq (34)). |
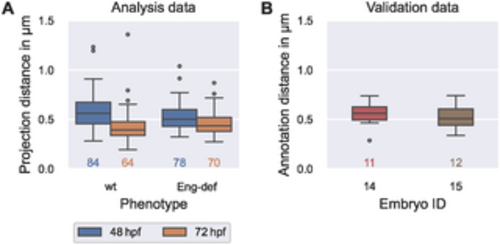
Comparability of errors introduced by vessel surface reconstruction and annotation uncertainty. (A) Distribution of the distances between manually annotated endothelial cell contours ECanno (analysis data) and their projections ECproj onto the estimated vessel surface (see Eq (36)), stratified by phenotype and time. (B) Distribution of distances (see Eq (36)) between first and second annotation of endothelial cells in two wild-type embryos at 72 hpf (validation data). The numbers below each box plot denote the corresponding numbers of cells. |
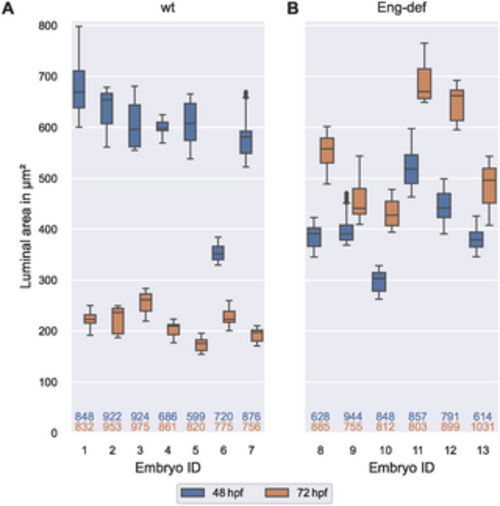
High between-embryo but low within-embryo variability in luminal area. Distribution of luminal areas of estimated DA cross-sections, stratified by embryo and time, for wild-type embryos (A) and for Endoglin-deficient embryos (B). Analysis based on cross-sections with at least two annotated cells present within a distance of 0.5 μm to the cross-sectional plane. The numbers below the box plots denote the corresponding numbers of vessel cross-sections. The top number corresponds to 48 hpf and the bottom number to 72 hpf. |
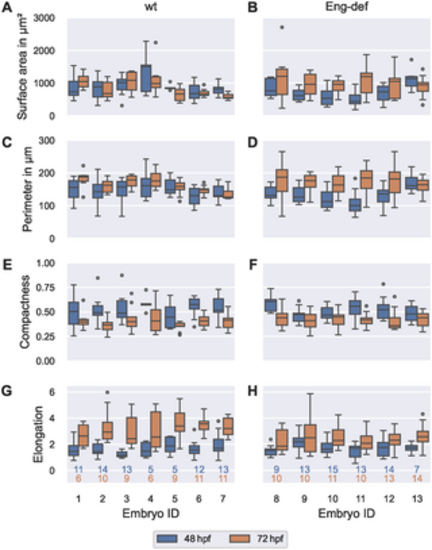
High between-embryo and high within-embryo variability in endothelial cell morphology. Distribution of morphometric measurements over all ECs, stratified by embryo and time, for wild-type embryos ((A), (C), (E) and (G)) and for Endoglin-deficient embryos ((B), (D), (F) and (H)). Analysis based on ECs with projection distances (onto the estimated vessel surfaces) comparable to or lower than the maximal annotation uncertainty of 0.742 μm. The numbers below the bottom box plots denote the corresponding numbers of cells for each column. The top number corresponds to 48 hpf and the bottom number to 72 hpf. |
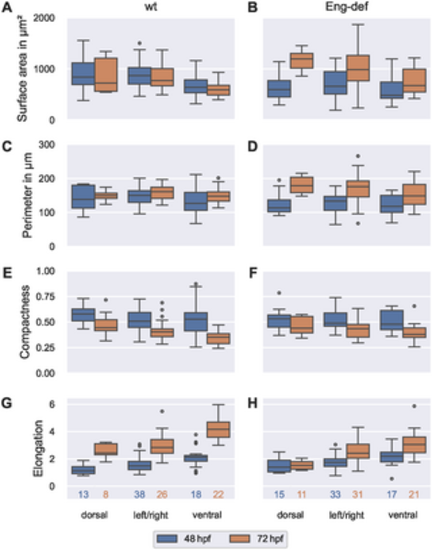
Dorsal-ventral asymmetry of endothelial cell morphology. Distribution of morphometric measurements over all ECs, stratified by location and time for wild-type embryos ((A), (C), (E) and (G)) and for Endoglin-deficient embryos ((B), (D), (F) and (H)). Analysis based on ECs with projection distances (onto the estimated vessel surfaces) comparable to or lower than the maximal annotation uncertainty of 0.742 μm. The numbers below the bottom box plots denote the corresponding numbers of cells for each column. |