
FIGURE
Fig. 5
- ID
- ZDB-FIG-240913-13
- Publication
- Seeler et al., 2024 - Novel mathematical approach to accurately quantify 3D endothelial cell morphology and vessel geometry based on fluorescently marked endothelial cell contours: Application to the dorsal aorta of wild-type and Endoglin-deficient zebrafish embryos
- Other Figures
- All Figure Page
- Back to All Figure Page
Fig. 5
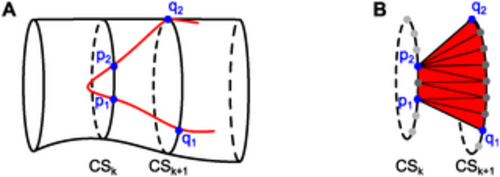
Triangulation within a projected cell contour. (A) In red, part of the projected cell contour on the smoothed vessel cross-sections is shown. To triangulate the part of the cell surface between cross-sections k and (k + 1), the edges (p1, q1) and (p2, q2) of the projected cell contour between these two cross-sections are identified. (B) A triangulation connects the cross-sectional path between p1 and p2 and the cross-sectional path between q1 and q2 within the cell surface. This triangulation is performed for each pair of neighboring vessel cross-sections that contains parts of the cell surface. |
Expression Data
Expression Detail
Antibody Labeling
Phenotype Data
Phenotype Detail
Acknowledgments
This image is the copyrighted work of the attributed author or publisher, and
ZFIN has permission only to display this image to its users.
Additional permissions should be obtained from the applicable author or publisher of the image.
Full text @ PLoS Comput. Biol.