
FIGURE
Fig. 11
- ID
- ZDB-FIG-240913-19
- Publication
- Seeler et al., 2024 - Novel mathematical approach to accurately quantify 3D endothelial cell morphology and vessel geometry based on fluorescently marked endothelial cell contours: Application to the dorsal aorta of wild-type and Endoglin-deficient zebrafish embryos
- Other Figures
- All Figure Page
- Back to All Figure Page
Fig. 11
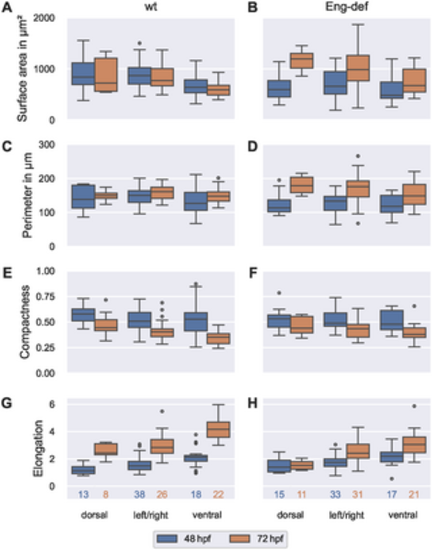
Dorsal-ventral asymmetry of endothelial cell morphology. Distribution of morphometric measurements over all ECs, stratified by location and time for wild-type embryos ((A), (C), (E) and (G)) and for Endoglin-deficient embryos ((B), (D), (F) and (H)). Analysis based on ECs with projection distances (onto the estimated vessel surfaces) comparable to or lower than the maximal annotation uncertainty of 0.742 μm. The numbers below the bottom box plots denote the corresponding numbers of cells for each column. |
Expression Data
Expression Detail
Antibody Labeling
Phenotype Data
Phenotype Detail
Acknowledgments
This image is the copyrighted work of the attributed author or publisher, and
ZFIN has permission only to display this image to its users.
Additional permissions should be obtained from the applicable author or publisher of the image.
Full text @ PLoS Comput. Biol.