
Image
|
Figure Caption
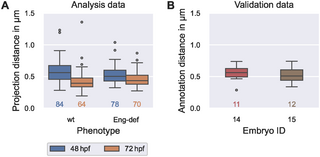
Fig. 8 Comparability of errors introduced by vessel surface reconstruction and annotation uncertainty. (A) Distribution of the distances between manually annotated endothelial cell contours ECanno (analysis data) and their projections ECproj onto the estimated vessel surface (see Eq (36)), stratified by phenotype and time. (B) Distribution of distances (see Eq (36)) between first and second annotation of endothelial cells in two wild-type embryos at 72 hpf (validation data). The numbers below each box plot denote the corresponding numbers of cells.
Acknowledgments
This image is the copyrighted work of the attributed author or publisher, and
ZFIN has permission only to display this image to its users.
Additional permissions should be obtained from the applicable author or publisher of the image.
Full text @ PLoS Comput. Biol.