
FIGURE
Fig. 3
- ID
- ZDB-FIG-240913-11
- Publication
- Seeler et al., 2024 - Novel mathematical approach to accurately quantify 3D endothelial cell morphology and vessel geometry based on fluorescently marked endothelial cell contours: Application to the dorsal aorta of wild-type and Endoglin-deficient zebrafish embryos
- Other Figures
- All Figure Page
- Back to All Figure Page
Fig. 3
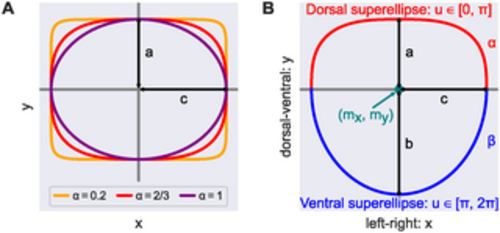
Cross-sectional shape model. (A) All points on the superellipses satisfy |x/c|2/α + |y/a|2/α = 1. For α = 1 the superellipse reduces to an ellipse. The smaller the value of α < 1, the closer the superellipse shape is to a rectangle. (B) We modeled DA cross-sections by joining two (half) superellipses. Here, (mx, my) is the shape’s midpoint and a, b, c are the shape’s semi-axis lengths; α, β specify the extent of flattening of each superellipse. |
Expression Data
Expression Detail
Antibody Labeling
Phenotype Data
Phenotype Detail
Acknowledgments
This image is the copyrighted work of the attributed author or publisher, and
ZFIN has permission only to display this image to its users.
Additional permissions should be obtained from the applicable author or publisher of the image.
Full text @ PLoS Comput. Biol.