
|
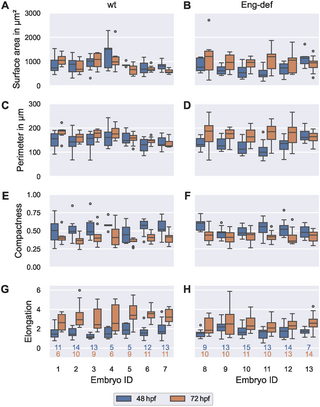
Fig. 10 High between-embryo and high within-embryo variability in endothelial cell morphology. Distribution of morphometric measurements over all ECs, stratified by embryo and time, for wild-type embryos ((A), (C), (E) and (G)) and for Endoglin-deficient embryos ((B), (D), (F) and (H)). Analysis based on ECs with projection distances (onto the estimated vessel surfaces) comparable to or lower than the maximal annotation uncertainty of 0.742 μm. The numbers below the bottom box plots denote the corresponding numbers of cells for each column. The top number corresponds to 48 hpf and the bottom number to 72 hpf.