
|
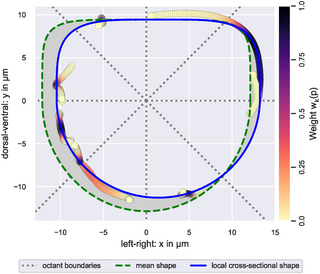
Fig. 4 Estimation of a local cross-sectional shape. Visualized is the local cross-sectional shape estimated from points (circles) on EC contour splines that were projected onto the cross-sectional (xy-)plane. Data points are colored according to their weight during the estimation, i.e., their distance along the z-axis from the local cross-sectional plane (see color bar). Note that data points with a weight of zero are omitted in the figure. The employed weight function ensured that the estimation was based on at least noct data points with non-zero weight per plane octant. Initial parameter values for the local cross-sectional shape were provided by the mean shape. During estimation, the deviation of the local cross-sectional shape from the mean shape, i.e., the area of the gray region relative to the area within the green dashed curve, was bound from above by λ. The illustrated cross-sectional shape was estimated using noct = 30 and λ = 20%.