
Fig. 2
- ID
- ZDB-FIG-240913-10
- Publication
- Seeler et al., 2024 - Novel mathematical approach to accurately quantify 3D endothelial cell morphology and vessel geometry based on fluorescently marked endothelial cell contours: Application to the dorsal aorta of wild-type and Endoglin-deficient zebrafish embryos
- Other Figures
- All Figure Page
- Back to All Figure Page
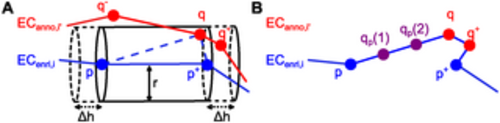
Cell contour enrichment. (A) Enrichment by neighboring cells. ECenri,i is the current version of the enriched cell contour of cell i. ECanno,i′ is the manually annotated cell contour of cell i′. In the previous iteration, it was checked whether point q− ∈ ECanno,i′ lies in any cylinder centered around an edge of ECenri,i. As q− was too far away from these edges, it was not inserted into ECenri,i. In the current iteration, it is found that q ∈ ECanno,i′ lies in the cylinder centered around the edge (p, p+) of ECenri,i with radius r and length h = ||p+ − p||2 + 2Δh. Thus, q is inserted into ECenri,i. Following insertion of q, point q+ will be inserted into ECenri,i in the subsequent iteration because it will be located within the cylinder centered around (q, p+). (B) Enrichment by interpolation. The enriched cell contour ECenri,i resulting from adding both q and q+ is shown. Two points qp(1) and qp(2) obtained by linear interpolation are added on the edge (p, q). |