
FIGURE
Fig. 1
- ID
- ZDB-FIG-240913-9
- Publication
- Seeler et al., 2024 - Novel mathematical approach to accurately quantify 3D endothelial cell morphology and vessel geometry based on fluorescently marked endothelial cell contours: Application to the dorsal aorta of wild-type and Endoglin-deficient zebrafish embryos
- Other Figures
- All Figure Page
- Back to All Figure Page
Fig. 1
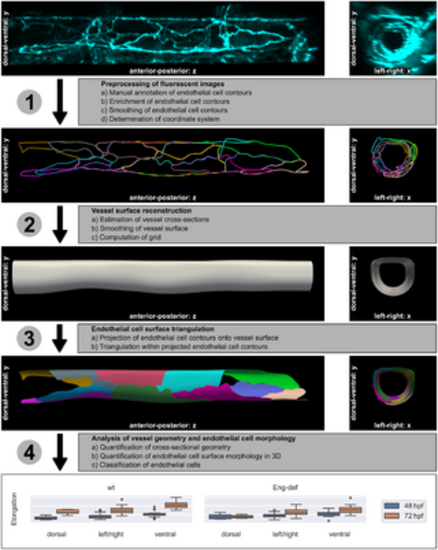
Method overview. The individual steps are explained in the text. The 3D microscopy image in the top row stems from Endoglin-deficient embryo 13 at 72 hpf and was used for the subsequent computations in the rows below. Elongation of ECs was quantified using the analysis data (see Table 1). |
Expression Data
Expression Detail
Antibody Labeling
Phenotype Data
Phenotype Detail
Acknowledgments
This image is the copyrighted work of the attributed author or publisher, and
ZFIN has permission only to display this image to its users.
Additional permissions should be obtained from the applicable author or publisher of the image.
Full text @ PLoS Comput. Biol.