
- Title
-
Reversible Influence of Hemipiperazine Photochromism on the Early Development of Zebrafish Embryo
- Authors
- Seliwjorstow, A., Takamiya, M., Rastegar, S., Pianowski, Z.
- Source
- Full text @ Chembiochem
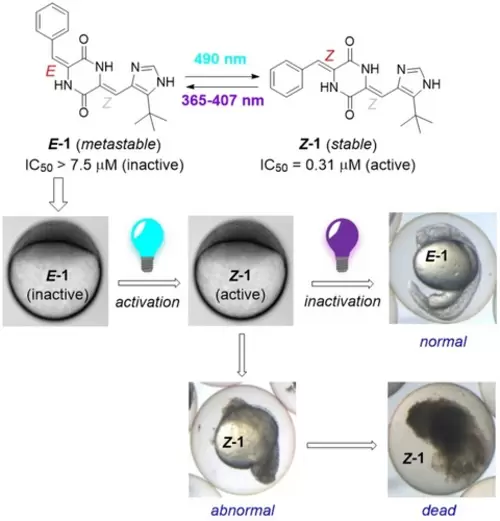
The Effect of Plinabulin Photoisomerization on Zebrafish Embryos. Plinabulin 1 inhibits microtubule dynamics, and can be photoisomerized between two thermally (meta)stable isomers with different activities. Here, we use 1 to reversibly control the epiboly in zebrafish embryos. The mitotic arrest caused by accumulation of the more toxic Z-1 can be reversed with light, before irreversible apoptosis takes place leading to embryos’ death. |
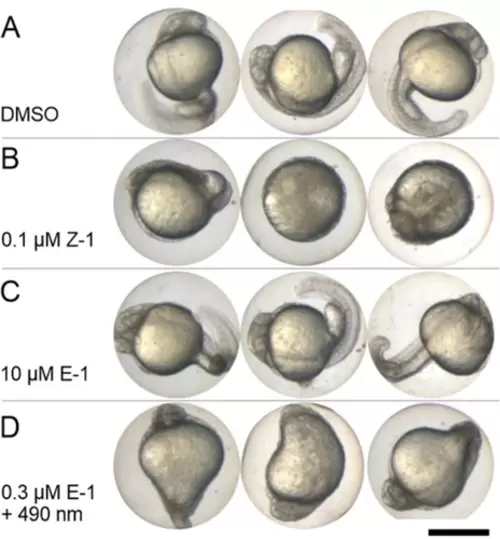
Phenotypic Effects of Different Isomeric Compositions of Plinabulin on Zebrafish Embryos for Sublethal Concentrations. A) negative control (DMSO 0.125 %) – No abnormal phenotype observed. B) 0.1 μM Z-1 (LD50=0.31 μM) – Severe malformation evident in embryos. C) 10 μM E-1 (LD50>7.5 μM) – Embryos exhibit normal appearance with no malformations or deaths. D) 0.3 μM E-1 irradiated with cyan light (490 nm) (LD50>1 μM for that mixture) – Embryos display malformation. Three representative embryos are depicted for each scenario. All pictures taken at 24 hpf. Scale bar: 500 μm. |
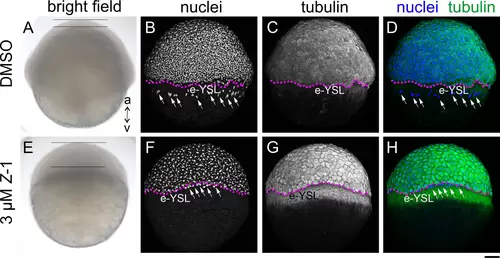
Treatment of Embryos with Z-1 Arrests Cell Division and Epiboly Movements. Phenotypic comparison between control (A-D, DMSO) and embryos treated with Z-1 (3 μM) (E-H) at 6 hpf, showcased through: (A and E) bright field view, (B and F; grayscale) DAPI nuclei staining, (C and G; grayscale) tubulin immunohisto staining, (D and H; nuclei in blue and tubulin in green) merged view of nuclei and tubulin; The animal pole (a) is oriented upwards, while the vegetal pole (v) is directed downwards. Notably, the Z-1-treated embryo (E) displays thickening of the blastoderm (span between two horizontal bars), a contrast to the control (A). Anomalous accumulation of tubulin is observed in the yolk syncytial layer (YSL) of Z-1-treated embryos, forming a belt-like structure vegetal to the blastoderm margin (stippled magenta line). The YSL nuclei (white arrows) were confined at the close vicinity of the blastoderm margin in the Z-1 treated embryo (F), while in the control they were found away from the margin and more in the vegetal region (B). Scale bar: 100 μm. |
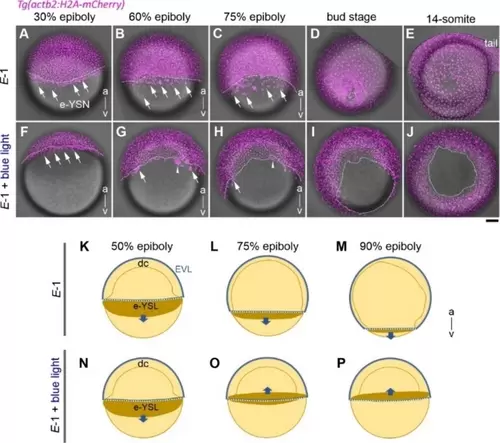
Real-time Imaging of Embryo Development Using a Fluorescently Labeled Nuclei Transgenic Line (magenta; Tg(actb2:H2 A-mCherry)). The upper row of each panel shows an embryo treated with 1 μM of E-1 without exposure to the blue light (450-490 nm) (A–E), and the lower panels show an embryo treated with the same reagent and further exposed to the blue light to produce the Z-1 isomer in situ (F–J). Stages are 30 % epiboly (4.7 hpf; A, F), 60 % epiboly (6.8 hpf; B, G), 75 % epiboly (7.9 hpf; C, H), bud stage (9.6 hpf; D, I) and 14 somite stage (16 hpf; E, J). The stippled white line demarcates the blastoderm margin. The external yolk syncytial nuclei (e-YSN) are pointed by arrows. Note that the e-YSN normally migrate toward the vegetal pole in the control (A-C). After blue light illumination, however, a group of e-YSN (F–H, arrowhead) together with other e-YSNs (arrows) abnormally migrates toward the animal pole relative to the blastoderm margin (stippled white line) and becomes internalized beneath the blastoderm. As a result, the epiboly was arrested at later stages (I–J). For early stages (A–C and F–H) the embryo is oriented the animal (a) pole up and the vegetal (v) pole down. Scale bar: 100 μm; (K–P) Schematics of the E-1 treated gastrulae highlighting the external yolk syncytial layer (e-YSL brown) at stages of 50 % epiboly (K, N), 75 % epiboly (L, O) and 90 % epiboly (M, P), with (N-P) or without (K-M) blue light illumination. Note the abnormal animal-ward migration of e-YSL beyond the blastoderm margin (white stippled line; upward arrows in O-P) after blue light treatment. EVL: enveloping layer; dc: deep cells. |
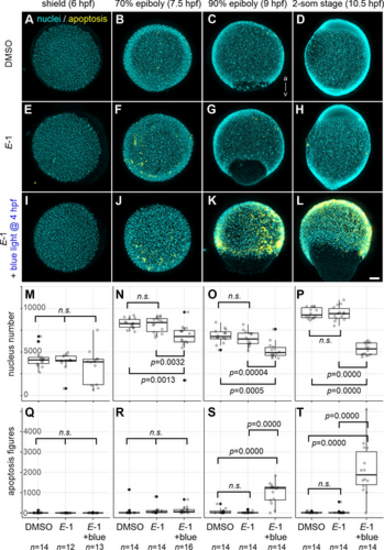
Cyan Light-Induced Mitotic Arrest Followed by Apoptosis in E-1 Treated Embryos. Zebrafish embryos at 4 hpf were transferred to E3 medium containing DMSO (A–D) or E-1 (E–L). A subset of E-1-treated embryos underwent cyan light (490 nm) exposure for 1 hour (I–L). All embryo groups were subsequently grown in darkness until either 6 hpf (shield stage; A, E, I), 7.5 hpf (70 % epiboly; B, F, J), 9 hpf (90 % epiboly; C, G, K) or 10.5 hpf (2-som stage; D, H, L) and fixed for the analysis of nuclei number (DAPI staining; cyan) and apoptotic figures (immunohistochemistry using anti-activated caspase-3 antibody; yellow). Embryos were oriented either for the animal pole view (A–B, E–F, I–J) or the lateral view with the animal pole up and dorsal right (C–D, G–H, K–L). (M–P) Number of nuclei per individual embryo. Note that the absolute values from different stages are not directly comparable because of the fact that only one-third of the embryo was captured in 3D volumetric imaging. (Q–T) Number of apoptotic figures per individual embryo. n.s.: not significant; Scale bar: 100 μm; n >12. |
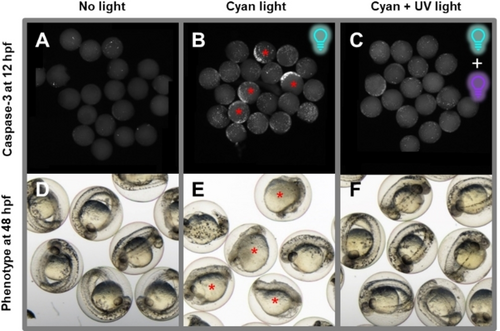
Reversible Embryo Growth Arrest with E-1 and Two Light Frequencies. Embryos were treated with 0.2 μM of E-1 at 4 hpf and immediately exposed to cyan light (490 nm, B–C, E–F) for 60 minutes to produce mostly Z-1 or left non-irradiated as control (A, D). At 5.5 hpf, part of the embryos was exposed to 365 nm irradiation for 12 minutes to convert most of the Z-1 into its less toxic E-isomer (C, F). Then, all embryos were rinsed with E3 medium at 6.5 hpf, to remove plinabulin from the environment. Afterwards, one group of embryos was incubated until 12 hpf and subsequently fixed and their apoptotic cells were stained (immunohistochemistry using anti-activated caspase-3 antibody; white spots; A–C). The other group was incubated until 48 hpf to analyze their phenotype for long-term development after treatment (D–F). The group treated without inactivation (exposure to the more toxic Z-1 isomer for 2.5 hours) displays a pronounced number of apoptotic cells at 12 hpf and predominantly malformed embryos with improperly developed heads and tails at 48 hpf (B, E; red asterisks). Embryos inactivated using UV light (365 nm) at 5.5 hpf (1.5 hours exposure to Z-1) exhibit a low number of apoptotic cells at 12 hpf and correctly developed heads, tails, and regular internal structure at 48 hpf (C, F). |
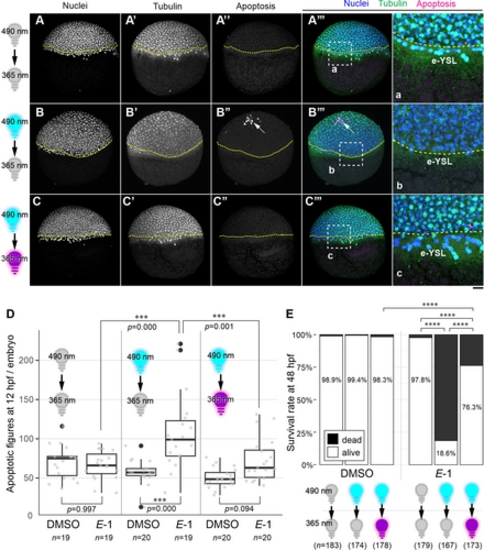
Light Controls the Apoptosis Induction Activity and Toxicity of 1. (A–c) Embryos at 4 hpf were incubated in E3 medium containing either DMSO or 0.2 μM E-1 (all images shown here correspond to the incubation with E-1). Groups of embryos were either kept in the dark (A-A’’’), illuminated only with 490 nm blue light at 4 hpf (B–B’’’), or illuminated first with 490 nm at 4 hpf and subsequently at 5.5 hpf with 365 nm light (C–C’’’) until they are fixed at 7 hpf for DAPI nuclear staining (A–C), immunohistochemistry for tubulin (A’–C’) and activated caspase-3 (apoptosis; A’’–C’’). Arrows indicate apoptotic figures. Yellow stippled lines demarcate the blastoderm margin. (A’’’–C’’’) Merged images for nuclei (blue, A–C), tubulin (green, A’–C’) and apoptosis channels (magenta, A’’–C’’). Magnified views of the regions in white stippled rectangles in A’’’–C’’’ are shown in the panels a–c, respectively. e-YSL: external yolk syncytial layer. Note the reduced number of visible nuclei in the e-YSL after illumination with 490 nm, which was restored after second illumination of 365 nm light (c). Scale bar: 100 μm (A–C’’’) or 25 μm (a–c). (D) Quantification of apoptotic figures at 12 hpf. in situ illumination of embryos with 490 nm light increased the number of observed apoptotic figures per embryo (p=0.000), of which effect was partially rescued by subsequent 365 nm light illumination (p=0.094 for DMSO vs E-1 with 490 nm/365 nm illumination; p=0.001 for E-1 with 490 nm only vs 490 nm/365 nm illumination). Number of embryos for each group is shown at the bottom. (E) Survival rate analysis at 48 hpf. Number of embryos for each group is shown at the bottom. Illumination of 490 nm and 365 nm light were at 4 hpf and 5.5 hpf, respectively. Adjusted p-values of pairwise Fisher's test were calculated and denoted as **** when the values are less than 0.0001. |