
Fig. 7
- ID
- ZDB-FIG-240524-59
- Publication
- Seliwjorstow et al., 2024 - Reversible Influence of Hemipiperazine Photochromism on the Early Development of Zebrafish Embryo
- Other Figures
- All Figure Page
- Back to All Figure Page
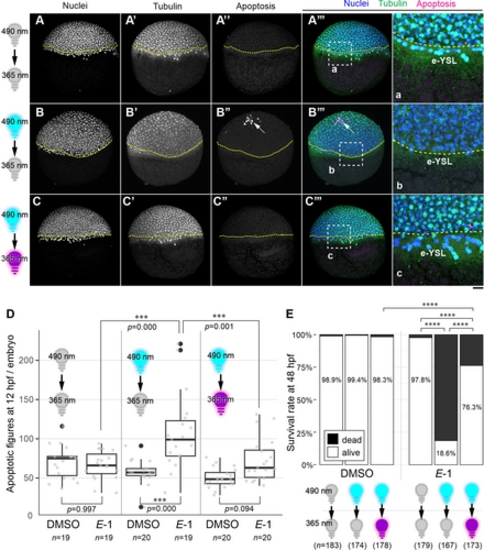
Light Controls the Apoptosis Induction Activity and Toxicity of 1. (A–c) Embryos at 4 hpf were incubated in E3 medium containing either DMSO or 0.2 μM E-1 (all images shown here correspond to the incubation with E-1). Groups of embryos were either kept in the dark (A-A’’’), illuminated only with 490 nm blue light at 4 hpf (B–B’’’), or illuminated first with 490 nm at 4 hpf and subsequently at 5.5 hpf with 365 nm light (C–C’’’) until they are fixed at 7 hpf for DAPI nuclear staining (A–C), immunohistochemistry for tubulin (A’–C’) and activated caspase-3 (apoptosis; A’’–C’’). Arrows indicate apoptotic figures. Yellow stippled lines demarcate the blastoderm margin. (A’’’–C’’’) Merged images for nuclei (blue, A–C), tubulin (green, A’–C’) and apoptosis channels (magenta, A’’–C’’). Magnified views of the regions in white stippled rectangles in A’’’–C’’’ are shown in the panels a–c, respectively. e-YSL: external yolk syncytial layer. Note the reduced number of visible nuclei in the e-YSL after illumination with 490 nm, which was restored after second illumination of 365 nm light (c). Scale bar: 100 μm (A–C’’’) or 25 μm (a–c). (D) Quantification of apoptotic figures at 12 hpf. in situ illumination of embryos with 490 nm light increased the number of observed apoptotic figures per embryo (p=0.000), of which effect was partially rescued by subsequent 365 nm light illumination (p=0.094 for DMSO vs E-1 with 490 nm/365 nm illumination; p=0.001 for E-1 with 490 nm only vs 490 nm/365 nm illumination). Number of embryos for each group is shown at the bottom. (E) Survival rate analysis at 48 hpf. Number of embryos for each group is shown at the bottom. Illumination of 490 nm and 365 nm light were at 4 hpf and 5.5 hpf, respectively. Adjusted p-values of pairwise Fisher's test were calculated and denoted as **** when the values are less than 0.0001. |