
|
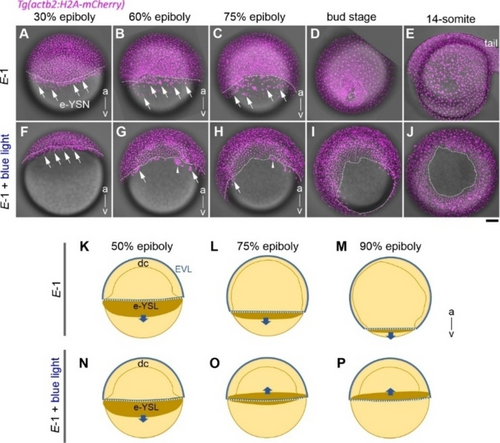
Fig. 4 Real-time Imaging of Embryo Development Using a Fluorescently Labeled Nuclei Transgenic Line (magenta; Tg(actb2:H2 A-mCherry)). The upper row of each panel shows an embryo treated with 1 μM of E-1 without exposure to the blue light (450-490 nm) (A–E), and the lower panels show an embryo treated with the same reagent and further exposed to the blue light to produce the Z-1 isomer in situ (F–J). Stages are 30 % epiboly (4.7 hpf; A, F), 60 % epiboly (6.8 hpf; B, G), 75 % epiboly (7.9 hpf; C, H), bud stage (9.6 hpf; D, I) and 14 somite stage (16 hpf; E, J). The stippled white line demarcates the blastoderm margin. The external yolk syncytial nuclei (e-YSN) are pointed by arrows. Note that the e-YSN normally migrate toward the vegetal pole in the control (A-C). After blue light illumination, however, a group of e-YSN (F–H, arrowhead) together with other e-YSNs (arrows) abnormally migrates toward the animal pole relative to the blastoderm margin (stippled white line) and becomes internalized beneath the blastoderm. As a result, the epiboly was arrested at later stages (I–J). For early stages (A–C and F–H) the embryo is oriented the animal (a) pole up and the vegetal (v) pole down. Scale bar: 100 μm; (K–P) Schematics of the E-1 treated gastrulae highlighting the external yolk syncytial layer (e-YSL brown) at stages of 50 % epiboly (K, N), 75 % epiboly (L, O) and 90 % epiboly (M, P), with (N-P) or without (K-M) blue light illumination. Note the abnormal animal-ward migration of e-YSL beyond the blastoderm margin (white stippled line; upward arrows in O-P) after blue light treatment. EVL: enveloping layer; dc: deep cells.