
- Title
-
A natural small molecule aspidosperma-type alkaloid, hecubine, as a new TREM2 activator for alleviating lipopolysaccharide-induced neuroinflammation in vitro and in vivo
- Authors
- Li, L., He, Y.L., Xu, N., Wang, X.F., Song, B., Tang, B.Q., Lee, S.M.
- Source
- Full text @ Redox Biol.
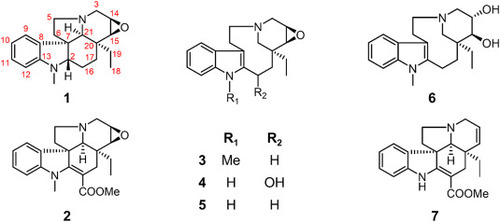
Chemical structures of Hecubine and its analogues (compounds 1–7). |
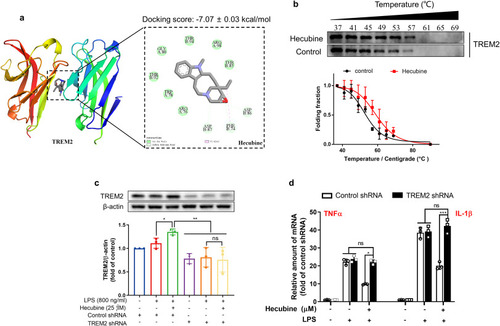
Hecubine directly binds to TREM2. (a) The interaction of Hecubine with the TREM2 protein in molecular docking analysis. (b) The CETSA assay determined the thermal stabilization of TREM2 interaction with Hecubine at a series of temperatures from 37 °C to 69 °C under a short drug exposure (1 h). (c) Western blot analysis of TREM2 knockdown in BV2 cells. Cells were transfected with negative control shRNA or TREM2 shRNA. n = 3; two-way ANOVA with Dunnett’s multiple comparisons test. (d) qPCR analysis of TNF-α and IL-1β in BV2 cells transfected with TREM2 shRNA. n = 3; two-way ANOVA with Dunnett’s multiple comparisons test. The data are presented as the mean ± SD of three independent experiments. *p < 0.05, **p < 0.01, and ***p < 0.001 vs. LPS-treated group; ns, not significant. |
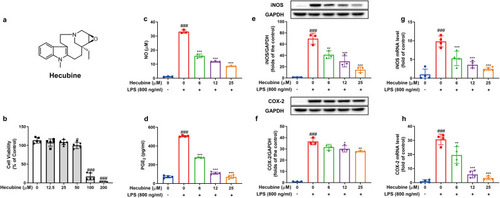
Hecubine blocked the NO/iNOS and PGE2/COX-2 pathways in LPS-activated BV-2 microglial cells. (a) Chemical structure of Hecubine. (b) The cell viability of Hecubine with respect to BV2 cells was determined using the MTT assay (n = 5). (c, d) Cells were treated with different doses of Hecubine (0–200 μM) for 24 h. NO levels in the cell culture medium were detected by Griess assay (c), and PGE2 production was determined by ELISA (c, n = 3; d, n = 4) (d). (e, f) Protein levels of iNOS and COX-2 were measured by Western blot analysis (n = 3). (g, h) The mRNA levels of iNOS and COX-2 were detected by RT-PCR analysis (n = 4). – and + represent the absence and presence of LPS (800 ng/ml), respectively. The data are presented as the mean ± SD of three independent experiments. *p < 0.05, **p < 0.01, and ***p < 0.001 vs. LPS-treated group; #p < 0.05 and ###p < 0.001 vs. control; One-way ANOVA with Dunnett’s multiple comparisons test |
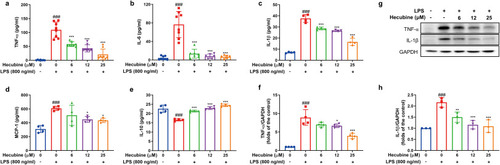
Hecubine affected the secretion and protein levels of inflammatory cytokines in LPS-stimulated BV-2 cells. Cells were pretreated with Hecubine for 1 h and then exposed to LPS for another 24 h. The production of TNF-α, n = 8 (a), IL-6, n = 6–8 (b), IL-1β, n = 4 (c), MCP-1, n = 4 (d), and IL-10, n = 4 (e) in the cell culture medium was determined by ELISA. (f–h) The protein expression levels of TNF-α (n = 4) and IL-1β (n = 3) were measured by Western blot analysis. – and + represent the absence and presence of LPS (800 ng/ml), respectively. The data are presented as the mean ± SD of three independent experiments. *p < 0.05, **p < 0.01, and ***p < 0.001 vs. LPS-treated group; ###p < 0.001 vs. control; One-way ANOVA with Dunnett’s multiple comparisons test. |

Hecubine abrogated the LPS-induced imbalance of TREM2 and TLR4 by down-regulating MAPK and PI3K/AKT signaling pathways in LPS-activated BV2 microglial cells. Cells were pretreated with Hecubine for 1 h and then stimulated with/without LPS. After that, the protein levels of TREM2 (Kruskal-Wallis test of One-way ANOVA) (a), TLR4 (Kruskal-Wallis test of One-way ANOVA) (b), MyD88 (c), the total and phosphorylated p38 MAPK (e), JNK (f), ERK 1/2 (g), and AKT (h) levels, were determined by Western blotting (a-g, n = 3; h, n = 6). (d) Cells were transfected with negative control shRNA or TREM2 shRNA, and then TLR4 expression level in BV2 cells after treatment with Hecubine or LPS was assessed by Western blot analysis. Quantitative analysis was carried out using ImageJ. – and + represent the absence and presence of LPS (800 ng/ml), respectively. The data are presented as the mean ± SD of three independent experiments. *p < 0.05, **p < 0.01, and ***p < 0.001 vs. LPS-treated group; ###p < 0.001 vs. control; ns, not significant; One-way ANOVA with Dunnett’s multiple comparisons test. |
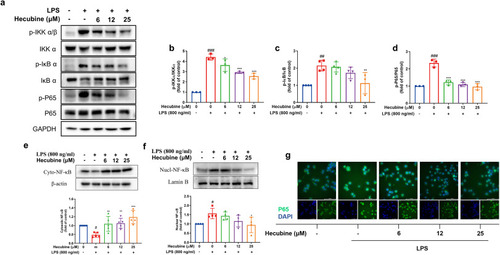
Hecubine suppressed LPS-triggered activation of the NF-κB p65 pathway in BV-2 cells. Cells were pretreated with Hecubine for 1 h and then stimulated with/without LPS. (a–d) The levels of total/phosphorylated IKKα/β (b), IκB α (c), and P65 (d) were measured via Western blot (b, n = 3; c, n = 4; d, n = 3). (e–f) The expression levels of total NF-κB p65 in the cytoplasmic fraction (n = 5) (e) and nuclear fraction (n = 4) (f) were quantified by Western blot. (g) The nuclear translocation of p65 was evaluated by immunofluorescence analysis. Cells were stained with anti-p65 antibody (green) and DAPI (blue). – and + represent the absence and presence of LPS (800 ng/ml), respectively. The data are presented as the mean ± SD of three independent experiments. *p < 0.05, **p < 0.01, and ***p < 0.001 vs. LPS-treated group; ###p < 0.001 vs. control; One-way ANOVA with Dunnett’s multiple comparisons test. (For interpretation of the references to colour in this figure legend, the reader is referred to the Web version of this article.) |
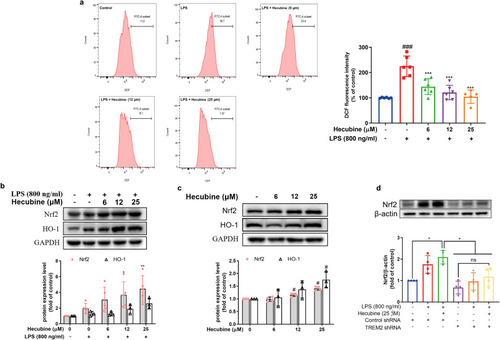
Hecubine suppressed ROS production but activated Nrf2 and HO-1 expression. Cells were pretreated with Hecubine for 1 h and then stimulated with/without LPS. (a) The ROS production was determined using flow cytometry analysis (n = 5–6). (b–c) The protein levels of Nrf2 (b, n = 5; c, n = 4) and HO-1 (b, n = 3; c, n = 3) were measured via Western blotting. (d) Cells were transfected with negative control shRNA or TREM2 shRNA. Nrf2 expression level in BV2 cells after treatment with Hecubine or LPS was assessed by Western blot analysis (n = 4). Quantitative analysis was carried out using ImageJ. – and + represent the absence and presence of LPS (800 ng/ml), respectively. The data are presented as the mean ± SD of at least three independent experiments. *p < 0.05, **p < 0.01, and ***p < 0.001 vs. LPS-treated group; ###p < 0.001 vs. control; ns, not significant; One-way ANOVA with Dunnett’s multiple comparisons test. |
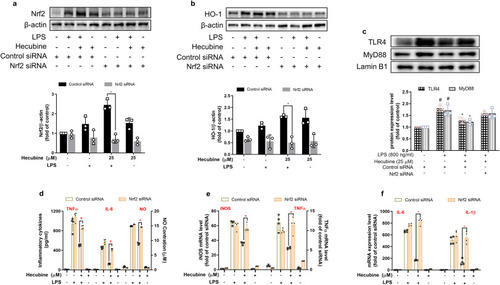
Blockade of Nrf2 abolished the anti-inflammatory effect of Hecubine. BV2 cells were treated with Hecubine in the presence or absence of LPS after transient transfection of Nrf2 siRNA and control siRNA. The protein levels of Nrf2 (a), HO-1 (b), TLR4, and MyD88 (c) were determined by Western blotting (n = 3). The production of TNF-α, IL-6, and NO (d) was measured via Griess reagent and an ELISA assay, respectively (n = 3). The mRNA levels of iNOS, TNF-α (e), IL-6, and IL-1β (f) were detected by qPCR analysis (n = 4). The data from the experiments are expressed as the mean ± SD of three independent experiments. *p < 0.05 vs. LPS-treated group; #p < 0.05 vs. control; One-way ANOVA with Dunnett’s multiple comparisons test. |
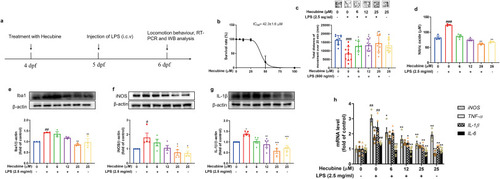
Hecubine modulated locomotor deficits and exhibited anti-inflammatory activity in LPS-stimulated zebrafish larvae. (a) Schematic of compound administration in zebrafish. (b) Toxicity of Hecubine in the zebrafish model (n = 12 zebrafish per group). (c) Representative patterns of behavioral locomotion in zebrafish larvae and quantitative analysis of zebrafish locomotion in the control and treated groups (n = 9∼10 zebrafish per group). (d) Production of NO measured by Griess assay (n = 3). (e–g) Protein expression of Ibal (n = 3) (e), iNOS (Kruskal-Wallis test of One-way ANOVA, n = 4) (f), and IL-1β (n = 5) (g) was quantified by Western Blot. (h) The mRNA expression levels of TNF-α, IL-1β, and IL-6 were analyzed by qPCR, n ≥ 4. The data are mean ± SEM. *p < 0.05 and **p < 0.01 vs. LPS-treated group; ###p < 0.001 vs. control; One-way ANOVA with Dunnett’s multiple comparisons test. |
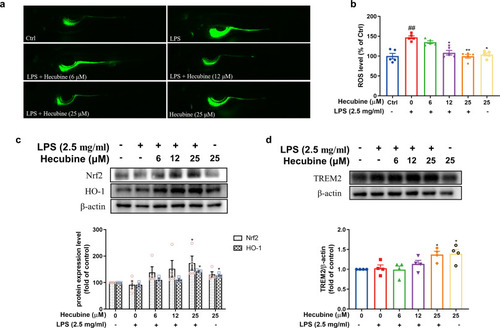
Hecubine exhibited an antioxidative effect in LPS-stimulated zebrafish larvae. Zebrafish larvae were treated as described above. (a) ROS levels were measured by image analysis and fluorescence microscopy; Kruskal-Wallis test of One-way ANOVA (n = 5). (b) Fluorescence intensity was quantified using ImageJ. The protein levels of Nrf2 (n = 4), HO-1 (n = 3) (c), and TREM2 (n = 4) (d) were assessed by Western Blot. The data are the mean ± SEM of at least three independent experiments. *p < 0.05, **p < 0.01, and ***p < 0.001 vs. LPS-treated group; ###p < 0.001 vs. control; One-way ANOVA with Dunnett’s multiple comparisons test. |