
|
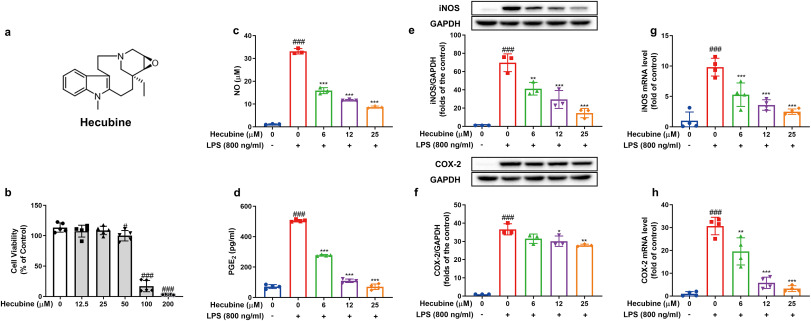
Fig. 3 Hecubine blocked the NO/iNOS and PGE2/COX-2 pathways in LPS-activated BV-2 microglial cells. (a) Chemical structure of Hecubine. (b) The cell viability of Hecubine with respect to BV2 cells was determined using the MTT assay (n = 5). (c, d) Cells were treated with different doses of Hecubine (0–200 μM) for 24 h. NO levels in the cell culture medium were detected by Griess assay (c), and PGE2 production was determined by ELISA (c, n = 3; d, n = 4) (d). (e, f) Protein levels of iNOS and COX-2 were measured by Western blot analysis (n = 3). (g, h) The mRNA levels of iNOS and COX-2 were detected by RT-PCR analysis (n = 4). – and + represent the absence and presence of LPS (800 ng/ml), respectively. The data are presented as the mean ± SD of three independent experiments. *p < 0.05, **p < 0.01, and ***p < 0.001 vs. LPS-treated group; #p < 0.05 and ###p < 0.001 vs. control; One-way ANOVA with Dunnett’s multiple comparisons test