
|
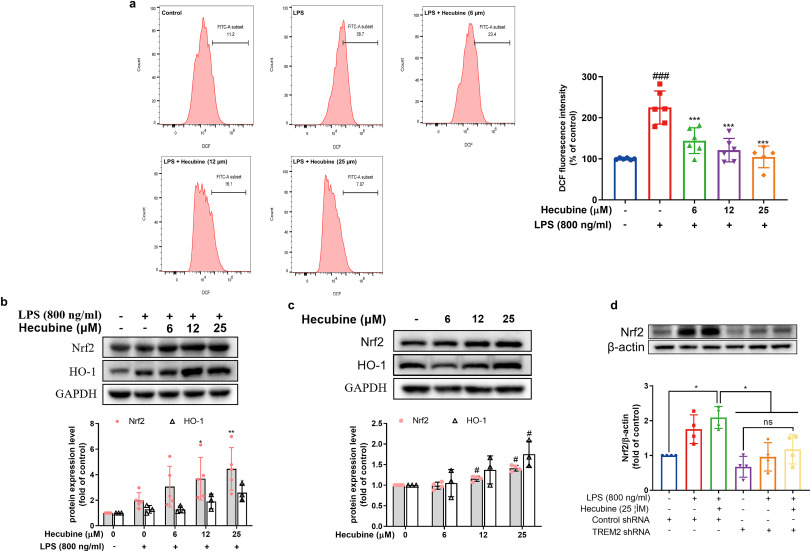
Fig. 7 Hecubine suppressed ROS production but activated Nrf2 and HO-1 expression. Cells were pretreated with Hecubine for 1 h and then stimulated with/without LPS. (a) The ROS production was determined using flow cytometry analysis (n = 5–6). (b–c) The protein levels of Nrf2 (b, n = 5; c, n = 4) and HO-1 (b, n = 3; c, n = 3) were measured via Western blotting. (d) Cells were transfected with negative control shRNA or TREM2 shRNA. Nrf2 expression level in BV2 cells after treatment with Hecubine or LPS was assessed by Western blot analysis (n = 4). Quantitative analysis was carried out using ImageJ. – and + represent the absence and presence of LPS (800 ng/ml), respectively. The data are presented as the mean ± SD of at least three independent experiments. *p < 0.05, **p < 0.01, and ***p < 0.001 vs. LPS-treated group; ###p < 0.001 vs. control; ns, not significant; One-way ANOVA with Dunnett’s multiple comparisons test.