
- Title
-
Involvement of nr2f genes in brain regionalization and eye development during early zebrafish development
- Authors
- Chowdhury, G., Umeda, K., Ohyanagi, T., Nasu, K., Yamasu, K.
- Source
- Full text @ Dev. Growth Diff.

Dynamic expression patterns of nr2f1/2 genes in the embryonic brain during development. (a) Expression patterns of nr2f1/2 genes after 14 hpf in the brain, visualized by whole-mount in situ hybridization, are shown. All are lateral views with the anterior side to the left and the dorsal side to the top. Expression in the ventricular zone is marked with arrowheads. (b) Expression patterns of nr2f1/2 in the forebrain and eyes. The outer rim of the eyes is marked with white dotted lines. Dorsal views with the anterior side to the bottom. (c) Summary of the temporal patterns of nr2f expression in the telencephalon. am, anterior midbrain; at, anterior tegmentum; ce, cerebellum; di, diencephalon; ey, eye; hb, hindbrain; ht, hypothalamus; ph, pharyngeal arch; te, telencephalon. Scale bars, 200 μm. EXPRESSION / LABELING:
|

Disruption of the nr2f genes by the CRISPR/Cas9 technique. The functional domains or the N-terminal region of nr2f genes was disrupted by co-injection of gRNA and Cas9 protein. (a–c) The target sequences (shown in red) with adjacent PAM sites (yellow) are shown with the flanking sequences for the HMA primers (HMA-s and HMA-as). (a′–c′) Schematic views showing the structures of wild-type and mutant Nr2f proteins. The DNA-binding domains, ligand-binding domains, Nr2f sequences, and nonsense sequences due to frameshift are shown in red, blue, gray, and white, respectively. The target sites are shown with open triangles. The sizes of the gene products are shown on the right with those of wild-type Nr2f sequences in parentheses. |

Deformed morphology of the head in nr2f mutants. The heads of embryos obtained by heterozygotic crosses for nr2f1a mutants (a–b″), nr2f1b mutants (c–d″), and nr2f2 mutants (e–f″) are shown at 24 hpf (a–f) and 5 dpf (a′–f″) in lateral views with the anterior side to the left and the dorsal side to the top (a–f′) or dorsal views with the anterior side to the left (a″–f″). Each embryo was genotyped after capturing images. Wild-type embryos and heterozygotes, which were morphologically indistinguishable, are combined and shown on the left (a–a″, c–c″, e–e″), whereas homozygotes (b–b″, d–d″, f–f″) are shown on the right. At the bottom right, the number of embryos with the shown morphology and the total number of embryos with the indicated genotype are shown. The posterior boundaries of the telencephalon are shown with white dashed curves. Arrows indicate the anomalies observed in homozygotes. mhb, midbrain–hindbrain boundary; ov, otic vesicle; pc, pericardial cavity. For the rest of abbreviations, see the legend to Figure 1. Scale bar, 200 μm. |
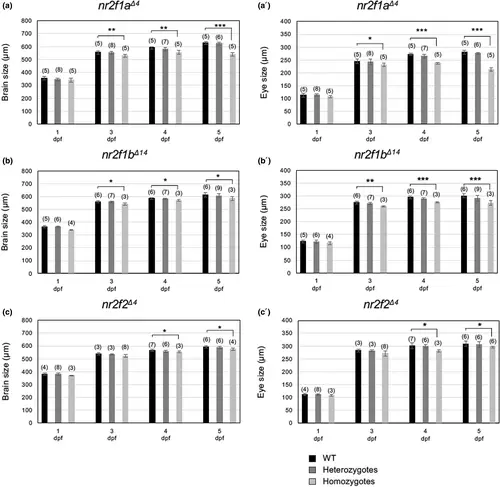
Quantification of the sizes of the brain and eyes. The sizes of the brain (a–c) and eye (a′–c′) of the embryos obtained from crosses between nr2f1 heterozygous fish were quantified at 1–5 dpf. Quantification was conducted using the line tool of ImageJ. To determine brain size, the distance from the anterior end of the telencephalon to the posterior margin of the otic vesicle was measured in the lateral view at 24 hpf and in the dorsal view at later stages. To determine eye size, the diameters of the optic vesicles along the anteroposterior axes were quantified in the lateral view. Differences were analyzed by the Student's t-test. Asterisks indicate significant differences (*p > .05; **p > .01; ***p > .001). PHENOTYPE:
|
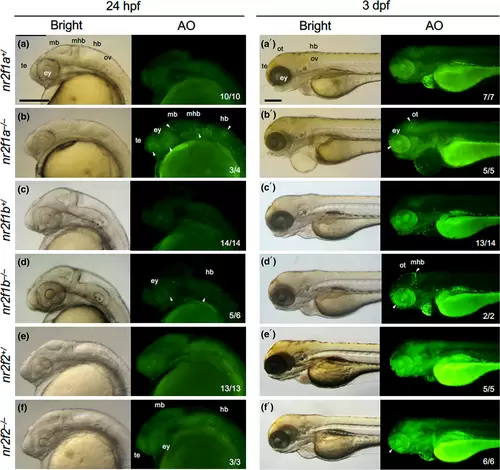
Detection of dying cells in nr2f mutant embryos. Dying cells were stained with acridine orange (AO) in the progeny embryos obtained by mating between nr2f1a heterozygous fish (nr2f1a+/−), between nr2f1b heterozygous fish (nr2f1b+/−), and between nr2f2 |

Expression patterns of brain marker genes in nr2f1a mutant embryos. The expression patterns of brain marker genes were examined by whole-mount in situ hybridization in progeny embryos obtained by mating between nr2f1a heterozygous fish (nr2f1a+/− |
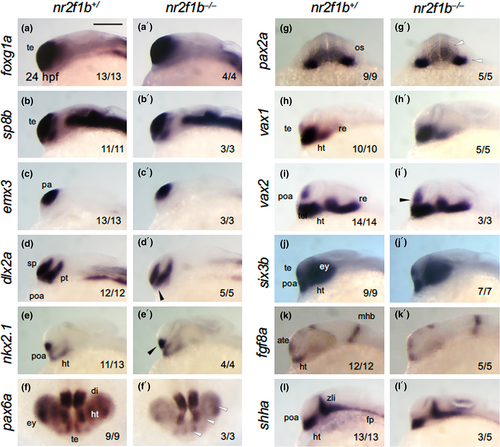
Expression patterns of brain marker genes in nr2f1b mutant embryos. The expression patterns of brain marker genes were examined by WISH in progeny embryos obtained by mating between nr2f1b heterozygous fish (nr2f1b+/− |
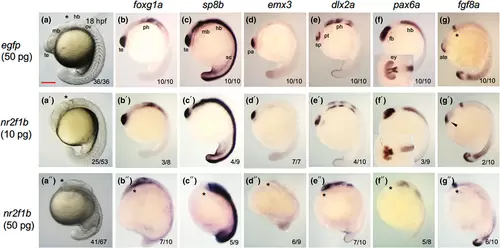
Effects of nr2f1 overexpression by mRNA injection on brain regionalization. Embryos were injected with nr2f1b mRNA (10 pg/embryo or 50 pg/embryo), followed by assessment of regional gene expression patterns at 18 hpf by WISH. At the bottom right, the number of embryos with the indicated phenotype and the total number of scored embryos are shown. Lateral views with the anterior side to the left and the dorsal side to the top are shown, except for the insets, which show dorsal views of the heads. Positions of the midbrain–hindbrain boundary are marked with asterisks. sc, spinal cord. For the remaining abbreviations, see the legends to the preceding figures. Scale bar, 200 μm. |