
Fig. 8
- ID
- ZDB-IMAGE-240416-22
- Publication
- Chowdhury et al., 2024 - Involvement of nr2f genes in brain regionalization and eye development during early zebrafish development
- All Figures
- Figures for Chowdhury et al., 2024
|
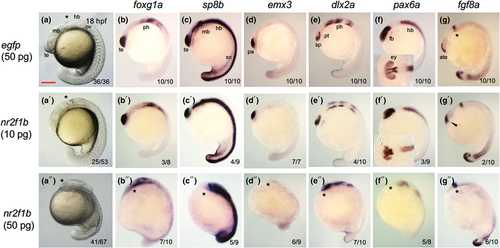
Fig. 8 Effects of nr2f1 overexpression by mRNA injection on brain regionalization. Embryos were injected with nr2f1b mRNA (10 pg/embryo or 50 pg/embryo), followed by assessment of regional gene expression patterns at 18 hpf by WISH. At the bottom right, the number of embryos with the indicated phenotype and the total number of scored embryos are shown. Lateral views with the anterior side to the left and the dorsal side to the top are shown, except for the insets, which show dorsal views of the heads. Positions of the midbrain–hindbrain boundary are marked with asterisks. sc, spinal cord. For the remaining abbreviations, see the legends to the preceding figures. Scale bar, 200 μm.