
- Title
-
Dynamics of macrophage polarization support Salmonella persistence in a whole living organism
- Authors
- Leiba, J., Sipka, T., Begon-Pescia, C., Bernardello, M., Tairi, S., Bossi, L., Gonzalez, A.A., Mialhe, X., Gualda, E., Loza-Alvarez, P., Blanc-Potard, A., Lutfalla, G., Nguyen-Chi, M.E.
- Source
- Full text @ Elife
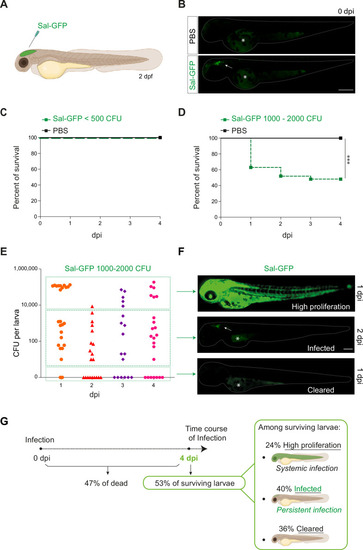
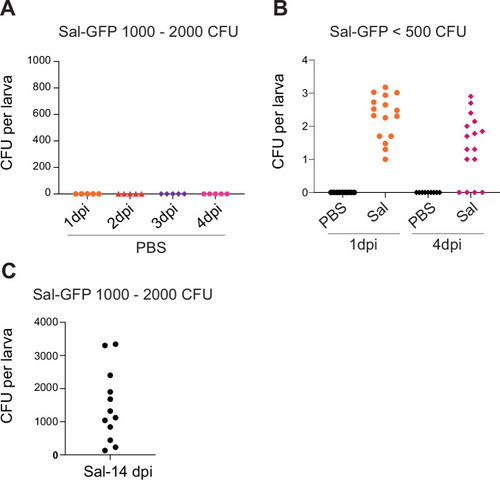
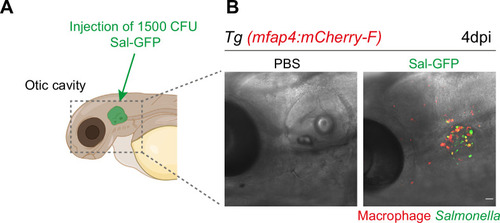
Zebrafish is a pertinent model for persistent Salmonella infection. (A) Schematic illustration of 2 dpf zebrafish embryo infected in the hindbrain ventricle (HBV) with Sal-GFP, a GFP-expressing strain. (B) Representative fluorescent images of HBV-injected larvae with either PBS or 1000 CFU of Sal-GFP shortly after microinjection. White arrow: bacteria in the HBV. Dots outline the larva. Asterisk: auto-fluorescence of the yolk. Scale bar: 200 μm. Survival curves of injected embryos with either PBS or different doses of Sal-GFP, that is (C) <500 CFU or (D) 1000–2000 CFU. One representative of three replicates (n = 24 larvae per condition). Log rank test, ***p < 0.001. (E) CFU counts per embryos infected with a range of 1000–2000 CFU of Sal-GFP at 1, 2, 3, and 4 dpi. Pool of four independent experiments (n1 dpi = 25, n2 dpi = 20, n3 dpi = 20, n4 dpi = 25 larvae). Kruskal–Wallis test (unpaired, non-parametric): not significant. (F) Representative fluorescent images of Sal-GFP-infected larvae. Bacteria are in green. Dots outline the larva. Asterisk: auto-fluorescence of the yolk. Scale bar: 200 μm. (G) Schematic representation of the different infection outcomes, High Proliferation, Infected, and Cleared, induced by injection of 1000–2000 CFU of Sal-GFP. From 0 to 4 dpi, 47% of the infected larvae developed a systemic infection where the bacteria displayed highly proliferation leading to larval death (High Proliferation). At 4 dpi, among the surviving larvae, 24% still exhibited a systemic infection, while 36% recovered from the infection with no detectable CFU (Cleared) and 40% contained persistent bacteria (Infected). |
( |
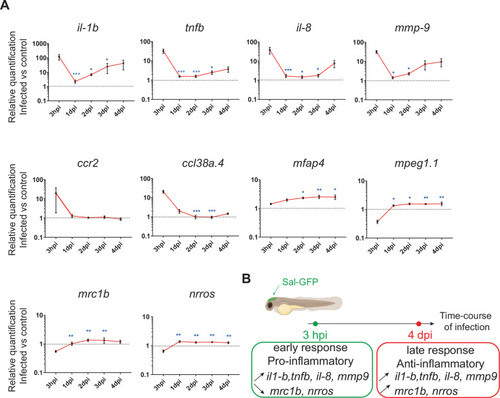
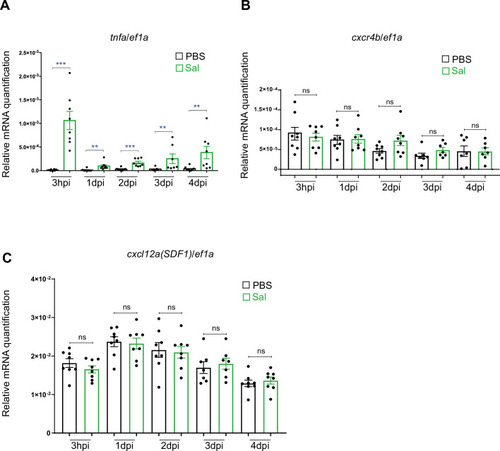
The global host inflammatory response to Salmonella infection. (A) RT-qPCR analysis of il1b, tnfb, il8, mmp9, ccr2, ccl38a.4, mpeg1, mfap4, mrc1b, and nrros, mRNA expression infected versus non-infected, normalized with ef1a. Larvae were either PBS- or Sal-GFP injected and RNA samples were extracted from whole larvae at 3 hpi, 1, 2, 3 and 4 dpi. After infection, larvae displaying ‘high proliferation’ of bacteria or bacteria ‘cleared’ were excluded from the analysis. Data are presented as relative expression in the infected larvae compared with the relevant PBS-injected controls (2−ΔΔCp). Values are the means ± standard error of the mean (SEM) of eight replicates (n = 8 larvae per time point). Kruskal–Wallis test (unpaired, non-parametric). *p < 0.05; **p < 0.01; ***p < 0.001 show significant differences compared to 3 hpi. (B) Diagram of global host inflammatory response to Salmonella infection. |
Expression of RT-qPCR analysis of ( |
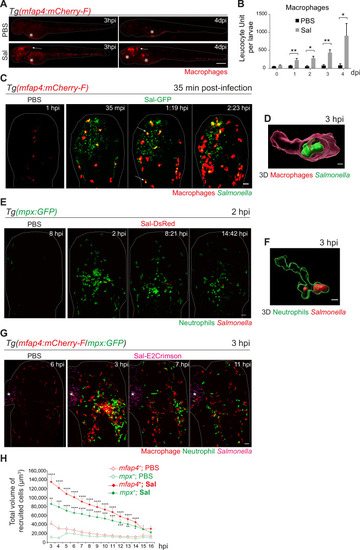
Early phase of Salmonella hindbrain ventricle (HBV) infection induces strong macrophage and neutrophil responses. (A–D) Tg(mfap4:mCherry-F) larvae were injected with either PBS or Sal-GFP in HBV. (A) Representative fluorescent images of larvae showing macrophage recruitment at the site of injection at 3 hpi and at 4 dpi. Asterisk: auto-fluorescence. Scale bar: 200 μm. (B) Quantification of total macrophages at 0, 1, 2, 3, and 4 dpi. One representative of three replicates (mean number of leukocyte units/larva ± SEM, n0 dpi = 24, n1 dpi = 11, n2 dpi = 6, n3,4 dpi = 5 per condition, Mann–Whitney test, two-tailed, *p < 0.05, **p < 0.01). (C) Representative maximum projections of fluorescent images extracted from 4D sequences using light sheet fluorescence microscopy starting 35 min post-infection during 2 hr, showing recruitment of macrophages (red) to the infection site (Salmonella, green). Scale bar: 30 μm. (D) 3D reconstruction of a macrophage phagocytosing Salmonella at 3 hpi. Scale bar: 5 μm. (E, F) Tg(mpx:GFP) larvae were injected with PBS or Sal-DsRed in HBV. (E) Representative maximum projections of fluorescent images extracted from 4D sequences using confocal microscopy at 2 hpi during 13 hr, showing recruitment of neutrophils (green) to the infection site (Salmonella, red). Scale bar: 35 μm. (F) 3D reconstruction of a neutrophil phagocytosing Salmonella at 2 hpi. Scale bar: 5 μm. (G, H) Tg(mfap4:mCherry-F/mpx:GFP) larvae were injected with either PBS or Sal-E2Crimson in HBV. (G) Representative maximum projections extracted from 4D sequences using confocal microscopy from 3 to 14 hpi showing recruitment of both neutrophils (green) and macrophages (red) to the infection sites. Asterisk: auto-fluorescence. Scale bar: 50 μm. (H) Quantification of the total volume of recruited cells (mfap4+ or mpx+ cells) from 3 to 16 hpi. Data of three replicates pooled (mean volume/larva ± SEM, n = 11 from 3 to 4 hpi, n = 15 from 5 to 14 hpi, n = 4 from 15 to 16 hpi per condition, Mann–Whitney test, two-tailed, significance of Sal versus PBS conditions *p < 0.05, **p < 0.01, ***p < 0.001, ****p < 0.0001). |
Macrophage response upon ( |
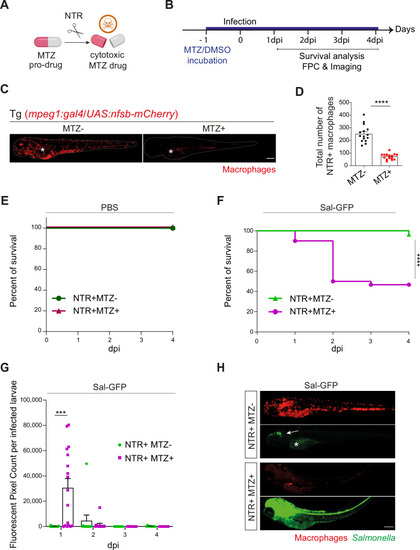
Macrophages are essential to control ( |

( |
Tg( |
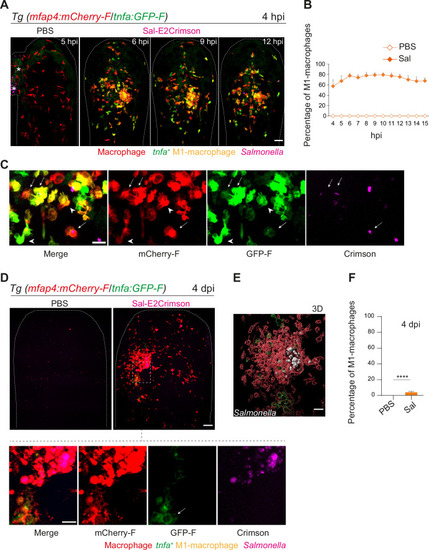
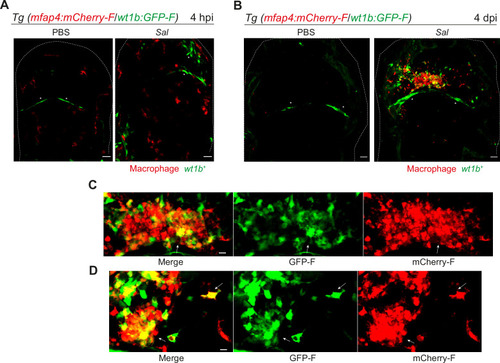
Macrophages polarize toward a pro-inflammatory M1-like phenotype upon Salmonella infection at early stage but not at late stage. (A–F) Tg(mfap4:mCherry-F/tnfa:GFP-F) larvae were injected with PBS or Sal-E2Crimson in HBV. (A) Representative maximum projections of fluorescent confocal images extracted from a 4D sequence, showing recruitment of macrophages (mfap4+ cells, red) and M1-like activation (mfap4+-tnfa+ cells, yellow) to Salmonella (magenta) from 4 to 15 hpi. Asterisk: auto-fluorescence. Scale bar: 50 μm. (B) Quantification of the percentage of M1 macrophages at indicated time post-infection. Data of two replicates pooled (mean percentage/larva ± SEM, n = 12 per condition). (C) Zoom of fluorescent confocal images in A. Scale bar: 20 μm, arrow: infected tnfa+ macrophages and arrowhead tnfa+ bystander macrophages. (D) Representative maximum projections of fluorescent confocal images of PBS-injected and Sal-E2Crimson-infected larvae at 4 dpi (upper panels). Scale bar: 50 μm. Zooms of regions boxed by dotted lines (bottom panels). Scale bar zoom: 10 μm. (E) 3D reconstruction of macrophage clusters (red) containing persistent Salmonella (gray), surrounded by few tnfa+ macrophages (green) at 4 dpi. Scale bar: 10 μm. (F) Quantification of the percentage of M1 macrophages at 4 dpi. Data of four replicates pooled (mean percentage/larva ± SEM, 4 dpi, nSal = 23 larvae, nPBS = 20, one sample Wilcoxon test, ****p < 0.0001). |

( |
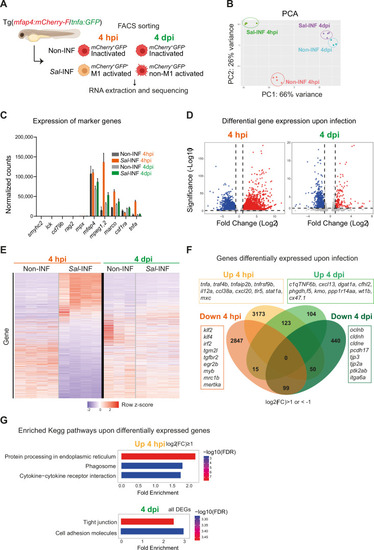
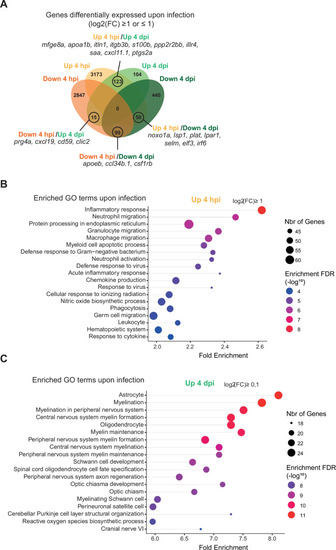
RNAseq analysis reveals macrophage transcriptome switch during Salmonella infection. (A) Schematic diagram of macrophage RNA-sequencing experimental design. Tg(mfap4:mCherry-F/tnfa:GFP-F) larvae were either infected with Salmonella (Sal-INF) or non-infected (Non-INF). Fluorescence-Activated Cell Sorting (FACS) was used to isolate mfap4+-tnfa− cells (mCherry+ GFP−) and mfap4+-tnfa+ cells (mCherry+ GFP+) at 4 hpi and 4 dpi. (B) Principal component analysis (PCA) score plot of mfap4+-tnfa− cells in Non-INF condition (n = 4) and mfap4+-tnfa+ cells in Sal-INF condition (n = 4) at 4 hpi and of mfap4+-tnfa− cells in Non-INF condition (n = 3) and mfap4+-tnfa− cells in Sal-INF condition (n = 4) at 4 dpi. (C) Normalized expression of several marker genes of muscle cells, lymphocytes, neutrophils, and macrophages in the different sorted macrophage populations. (D) Volcano plot showing differentially expressed genes (DEGs) between Non-INF and Sal-INF conditions at 4 hpi and 4 dpi. Adjusted p value (p-adj) <0.05 was used as the threshold to judge the significance of the difference in gene expression. Red plots: up-regulated genes; blue plots: down-regulated genes; gray plots: unchanged genes. (E) Heatmap of DEGs between macrophage populations across infection (p-adj <0.05|Log2(FC) ≥1). Selected top DEGs from each population are shown. Color coding, decreased expression: blue, no expression: white, high expression: red. (F) Venn diagram showing unique and intersecting up- or down-regulated genes (indicated as Up and Down, respectively) upon infection from macrophage transcriptome at 4 hpi and 4 dpi. The numbers of up- and down-regulated genes are indicated in bold in each unique and overlapping sector of the Venn diagram. The most noteworthy genes of each unique sector of the Venn diagram are indicated (p-adj <0.05|(Log2(FC) ≥1 or ≤1)). (G) Chart representation of Kyoto Encyclopedia of Genes and Genomes (KEGG) pathways enriched in up-regulated genes (p-adj <0.05|Log2(FC) ≥1) at 4 hpi (upper panel) and all DEGs at 4 dpi (lower panel) (p-adj <0.05). Graph shows the fold enrichment, red color: lowest enrichment false discovery rate (FDR) and blue color: highest enrichment FDR. |
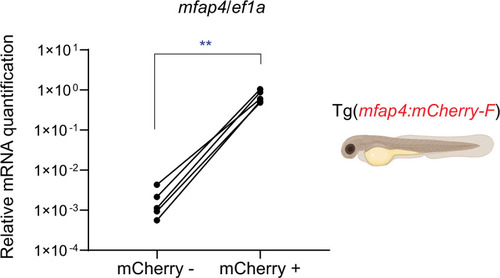
RT-qPCR analysis of |
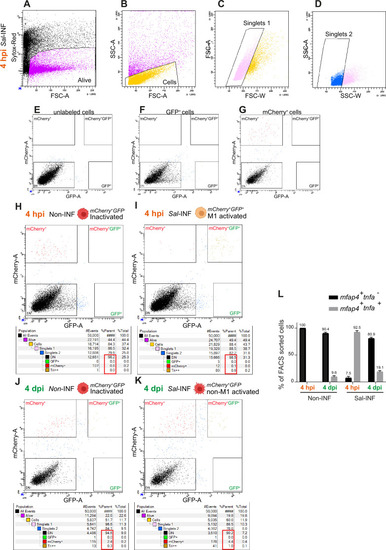
Macrophage populations were sorted by Fluorescence-Activated Cell Sorting (FACS) before transcriptomic analysis. ( |
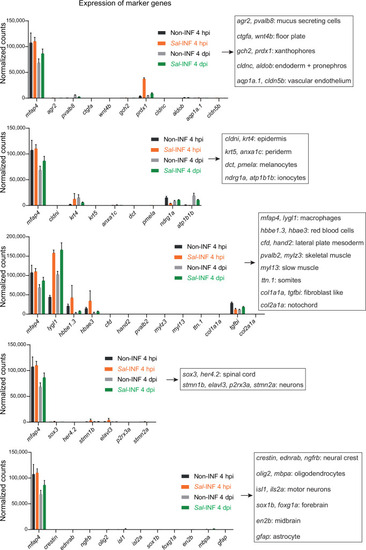
Normalized expression of marker genes confirms the purity of sorted macrophage populations. Tg( |
RNAseq analysis shows dynamic transcriptional profiles of macrophages upon Tg( |
( |
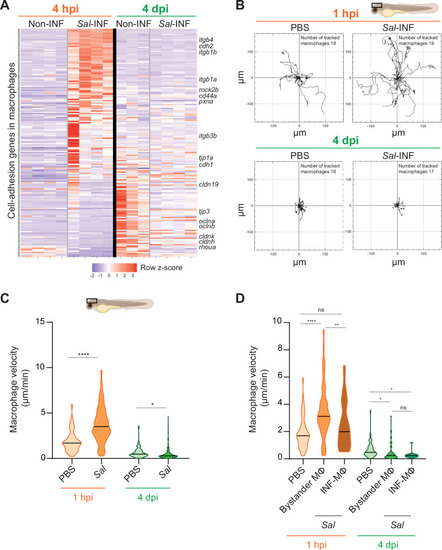
Salmonella persistence induces drastic changes in cell adhesion-related gene expression and motility in macrophages. (A) Heatmap of differentially expressed genes (DEGs) involved in cell adhesion, between macrophage populations across infection (p-adj <0.05). Selected DEGs from each population are indicated. Color coding, decreased expression: blue, no expression: white, high expression: red. (B–D) Tg(mfap4:mCherry-F) larvae were injected with PBS or Sal-E2Crimson in HBV and time-lapse videos of labeled macrophages were acquired during 2 hr at 1 hpi or 4 dpi. (B) Migration of macrophages in response to PBS or Sal-E2Crimson at 1 hpi or 4 dpi. Representative trajectory plots of individual macrophage movement tracks are shown, with the initial position in the center of the graph. Number of macrophage tracks are indicated. (C) Quantification of the individual macrophage velocity from PBS-injected or Sal-infected larvae at 1 hpi and 4 dpi. Data of four replicates per time point pooled (mean velocity/macrophage ± SEM, at 1 hpi: nPBS = 76, nSal = 195; at 4 dpi: nPBS = 93, nSal = 162; t-test, two-tailed, significance of Sal versus PBS conditions, ****p < 0.0001, *p < 0.05). (D) Quantification of the individual bystander macrophage or infected macrophage velocity from PBS-injected or Sal-infected larvae at 1 hpi and 4 dpi. Data of two replicates per time point pooled (mean velocity/macrophage ± SEM, at 1 hpi: nPBS = 76, nbystander-MΦ = 92; ninfected-MΦ = 33; at 4 dpi: nPBS = 93, nbystander-MΦ = 67; ninfected-MΦ = 17; analysis of variance (ANOVA) Kuskal–Wallis’ test with Dunns’ post-test, ****p < 0.0001, **p < 0.01, *p < 0.05, ns: not significant) |
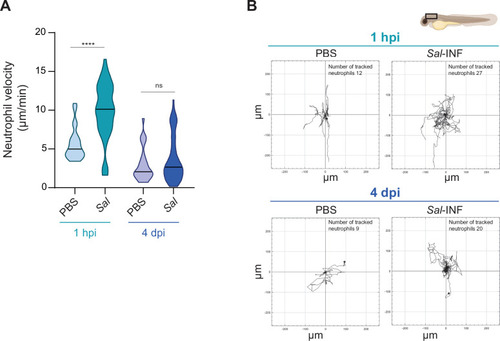
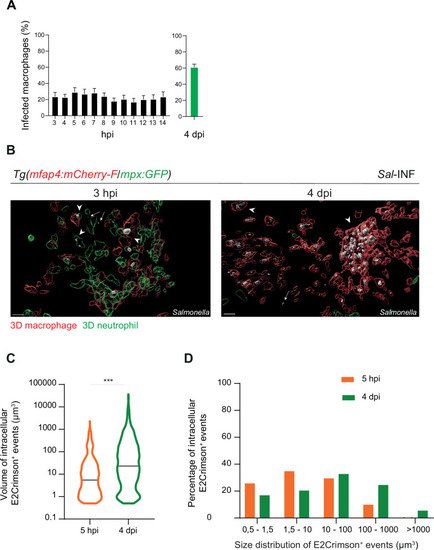
Neutrophils remain motile during the establishment of ( |
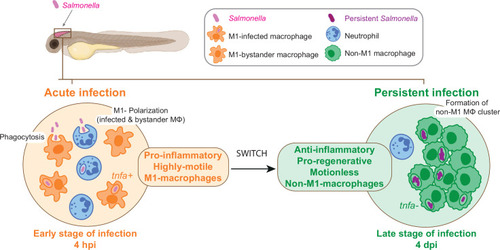
From acute to persistent Schematic representation of the two main phases of |