
Figure 1
- ID
- ZDB-FIG-240203-11
- Publication
- Leiba et al., 2024 - Dynamics of macrophage polarization support Salmonella persistence in a whole living organism
- Other Figures
-
- Figure 1
- Figure 1—figure supplement 1.
- Figure 2
- Figure 2—figure supplement 1.
- Figure 3
- Figure 3—figure supplement 1.
- Figure 3—figure supplement 2.
- Figure 4.
- Figure 5.
- Figure 6
- Figure 6—figure supplement 1.
- Figure 7
- Figure 7—figure supplement 1.
- Figure 7—figure supplement 2.
- Figure 7—figure supplement 3.
- Figure 7—figure supplement 4.
- Figure 8.
- Figure 9
- Figure 9—figure supplement 1.
- Figure 10.
- All Figure Page
- Back to All Figure Page
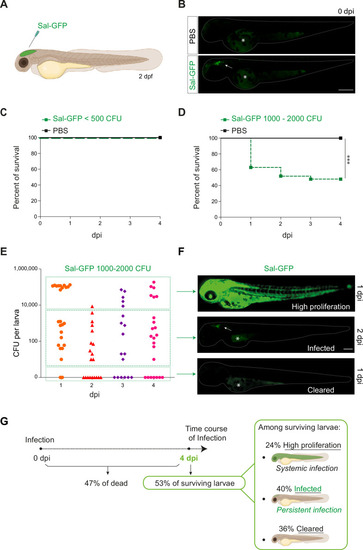
Zebrafish is a pertinent model for persistent Salmonella infection. (A) Schematic illustration of 2 dpf zebrafish embryo infected in the hindbrain ventricle (HBV) with Sal-GFP, a GFP-expressing strain. (B) Representative fluorescent images of HBV-injected larvae with either PBS or 1000 CFU of Sal-GFP shortly after microinjection. White arrow: bacteria in the HBV. Dots outline the larva. Asterisk: auto-fluorescence of the yolk. Scale bar: 200 μm. Survival curves of injected embryos with either PBS or different doses of Sal-GFP, that is (C) <500 CFU or (D) 1000–2000 CFU. One representative of three replicates (n = 24 larvae per condition). Log rank test, ***p < 0.001. (E) CFU counts per embryos infected with a range of 1000–2000 CFU of Sal-GFP at 1, 2, 3, and 4 dpi. Pool of four independent experiments (n1 dpi = 25, n2 dpi = 20, n3 dpi = 20, n4 dpi = 25 larvae). Kruskal–Wallis test (unpaired, non-parametric): not significant. (F) Representative fluorescent images of Sal-GFP-infected larvae. Bacteria are in green. Dots outline the larva. Asterisk: auto-fluorescence of the yolk. Scale bar: 200 μm. (G) Schematic representation of the different infection outcomes, High Proliferation, Infected, and Cleared, induced by injection of 1000–2000 CFU of Sal-GFP. From 0 to 4 dpi, 47% of the infected larvae developed a systemic infection where the bacteria displayed highly proliferation leading to larval death (High Proliferation). At 4 dpi, among the surviving larvae, 24% still exhibited a systemic infection, while 36% recovered from the infection with no detectable CFU (Cleared) and 40% contained persistent bacteria (Infected). |