
|
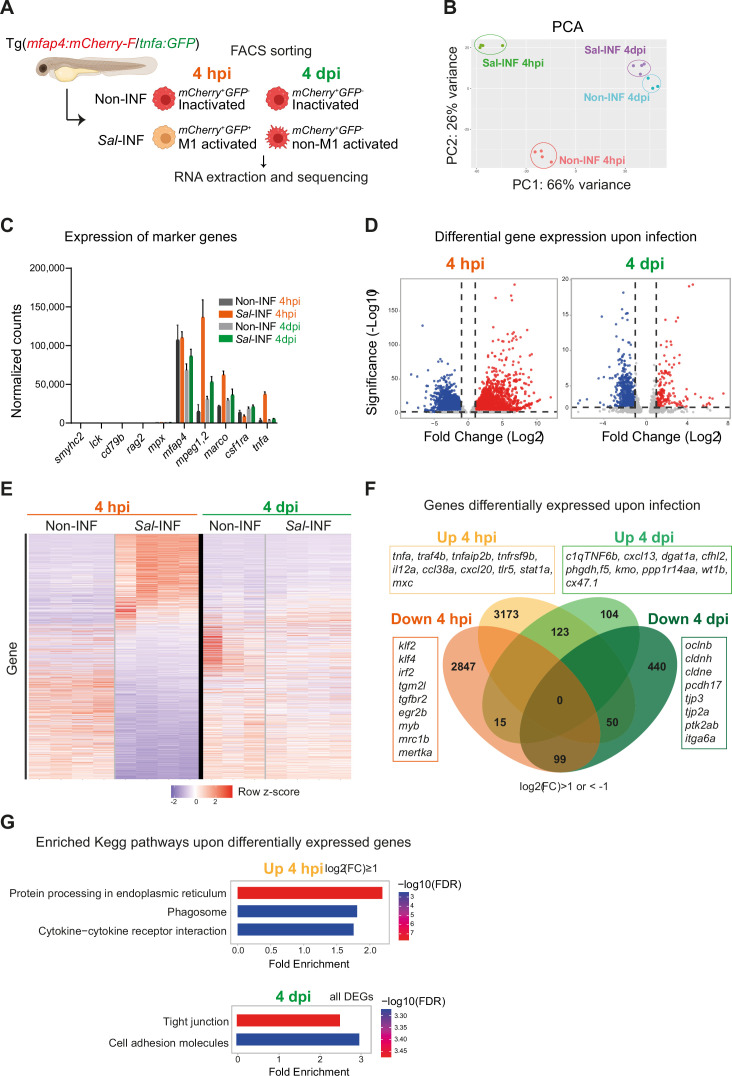
Figure 7 RNAseq analysis reveals macrophage transcriptome switch during Salmonella infection. (A) Schematic diagram of macrophage RNA-sequencing experimental design. Tg(mfap4:mCherry-F/tnfa:GFP-F) larvae were either infected with Salmonella (Sal-INF) or non-infected (Non-INF). Fluorescence-Activated Cell Sorting (FACS) was used to isolate mfap4+-tnfa− cells (mCherry+ GFP−) and mfap4+-tnfa+ cells (mCherry+ GFP+) at 4 hpi and 4 dpi. (B) Principal component analysis (PCA) score plot of mfap4+-tnfa− cells in Non-INF condition (n = 4) and mfap4+-tnfa+ cells in Sal-INF condition (n = 4) at 4 hpi and of mfap4+-tnfa− cells in Non-INF condition (n = 3) and mfap4+-tnfa− cells in Sal-INF condition (n = 4) at 4 dpi. (C) Normalized expression of several marker genes of muscle cells, lymphocytes, neutrophils, and macrophages in the different sorted macrophage populations. (D) Volcano plot showing differentially expressed genes (DEGs) between Non-INF and Sal-INF conditions at 4 hpi and 4 dpi. Adjusted p value (p-adj) <0.05 was used as the threshold to judge the significance of the difference in gene expression. Red plots: up-regulated genes; blue plots: down-regulated genes; gray plots: unchanged genes. (E) Heatmap of DEGs between macrophage populations across infection (p-adj <0.05|Log2(FC) ≥1). Selected top DEGs from each population are shown. Color coding, decreased expression: blue, no expression: white, high expression: red. (F) Venn diagram showing unique and intersecting up- or down-regulated genes (indicated as Up and Down, respectively) upon infection from macrophage transcriptome at 4 hpi and 4 dpi. The numbers of up- and down-regulated genes are indicated in bold in each unique and overlapping sector of the Venn diagram. The most noteworthy genes of each unique sector of the Venn diagram are indicated (p-adj <0.05|(Log2(FC) ≥1 or ≤1)). (G) Chart representation of Kyoto Encyclopedia of Genes and Genomes (KEGG) pathways enriched in up-regulated genes (p-adj <0.05|Log2(FC) ≥1) at 4 hpi (upper panel) and all DEGs at 4 dpi (lower panel) (p-adj <0.05). Graph shows the fold enrichment, red color: lowest enrichment false discovery rate (FDR) and blue color: highest enrichment FDR.